
Mindmap
Descriptive and Inferential Statistics
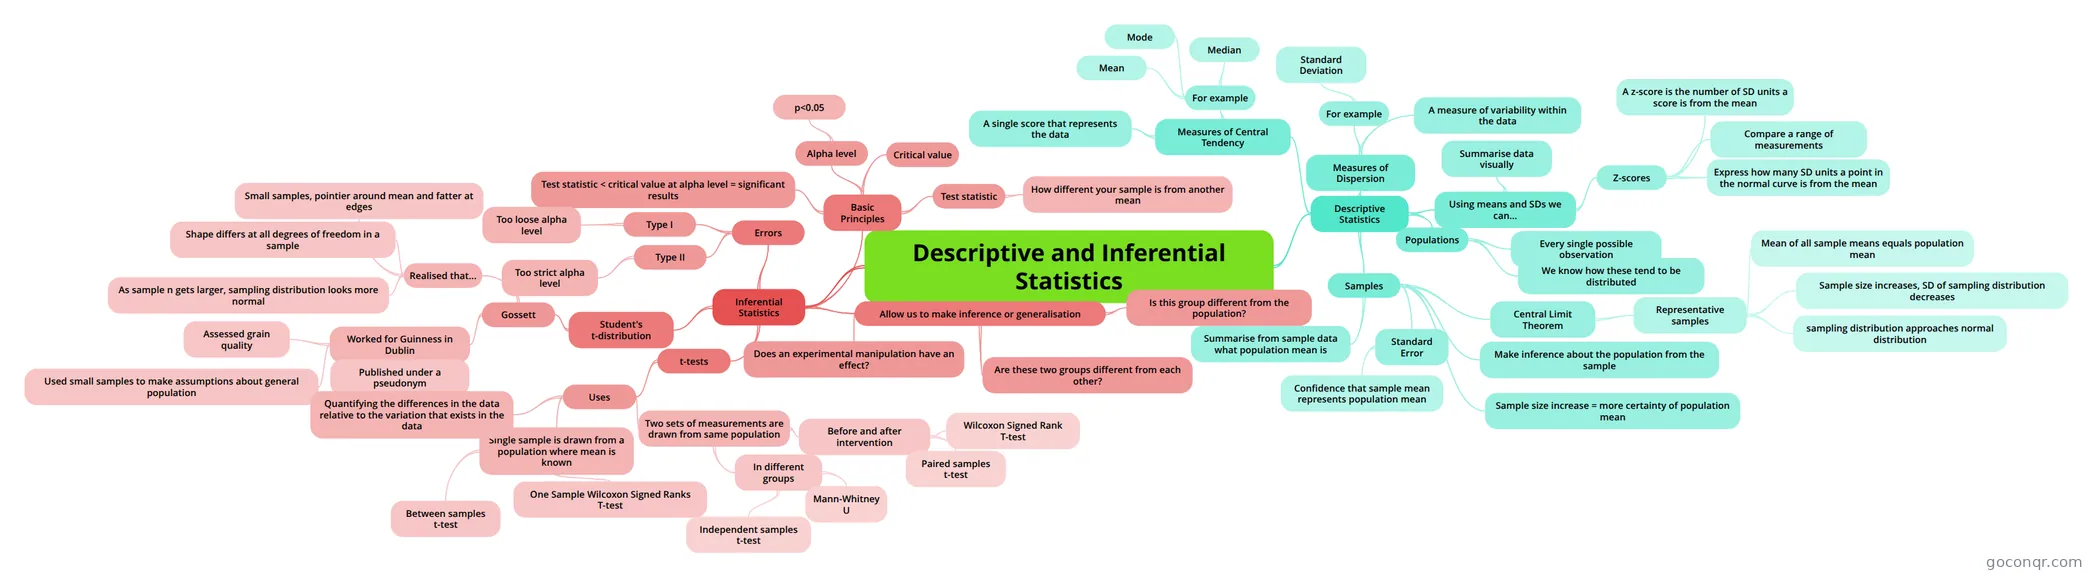
Mind map: Descriptive and inferential statistics
Inhalt der Mindmap
Descriptive and Inferential Statistics
Descriptive Statistics
- Measures of Central Tendency
- A single score that represents the data
- For example
- Mean
- Median
- Mode
- Measures of Dispersion
- A measure of variability within the data
- For example
- Standard Deviation
- Using means and SDs we can...
- Z-scores
- Compare a range of measurements
- Express how many SD units a point in the normal curve is from the mean
- A z-score is the number of SD units a score is from the mean
- Summarise data visually
- Z-scores
- Populations
- Every single possible observation
- We know how these tend to be distributed
- Samples
- Make inference about the population from the sample
- Summarise from sample data what population mean is
- Central Limit Theorem
- Representative samples
- sampling distribution approaches normal distribution
- Mean of all sample means equals population mean
- Sample size increases, SD of sampling distribution decreases
- Representative samples
- Sample size increase = more certainty of population mean
- Standard Error
- Confidence that sample mean represents population mean
- Measures of Central Tendency
Inferential Statistics
- Allow us to make inference or generalisation
- Is this group different from the population?
- Are these two groups different from each other?
- Does an experimental manipulation have an effect?
- Basic Principles
- Test statistic
- How different your sample is from another mean
- Critical value
- Alpha level
- p<0.05
- Test statistic < critical value at alpha level = significant results
- Test statistic
- Errors
- Type I
- Too loose alpha level
- Type II
- Too strict alpha level
- Type I
- Student's t-distribution
- Gossett
- Worked for Guinness in Dublin
- Assessed grain quality
- Used small samples to make assumptions about general population
- Published under a pseudonym
- Realised that...
- As sample n gets larger, sampling distribution looks more normal
- Small samples, pointier around mean and fatter at edges
- Shape differs at all degrees of freedom in a sample
- Worked for Guinness in Dublin
- Gossett
- t-tests
- Uses
- Single sample is drawn from a population where mean is known
- Between samples t-test
- One Sample Wilcoxon Signed Ranks T-test
- Two sets of measurements are drawn from same population
- In different groups
- Independent samples t-test
- Mann-Whitney U
- Before and after intervention
- Paired samples t-test
- Wilcoxon Signed Rank T-test
- In different groups
- Quantifying the differences in the data relative to the variation that exists in the data
- Single sample is drawn from a population where mean is known
- Uses
- Allow us to make inference or generalisation
Informationen
- Beschreibung
- Degree Psychology (Methodology and Statistics) Mindmap am Descriptive and Inferential Statistics, erstellt von natalieclark29 am 24/11/2013.
- Erstellt von
- natalieclark29
- Aufrufe
- 574
- Tags
- Bewertung