
Notizen
Unit 5 Project: It's Cold Outside!
Inhalt der Notizen (2)
Seite 1
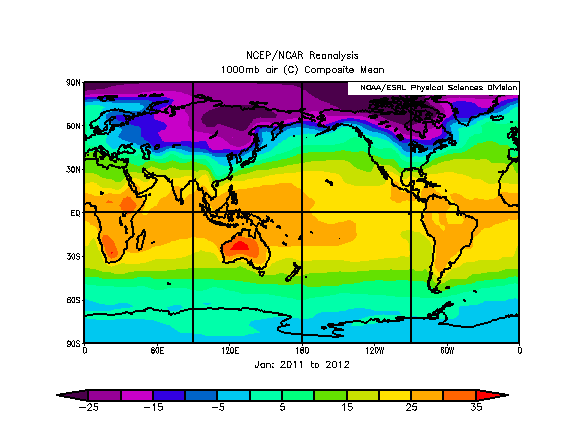
The map above was created at the National Oceanic and Atmospheric Administration (NOAA) website. It shows the relationship of latitudes and temperature trends.
Task 1: You will collect data, plot the points and calculate the line of best fit.
Task 2: You will be using your data from task one to make predictions.
Task 3: You will be investigating data from areas of similar latitudes and making conclusions about the correlation and causation of these two variables.
Seite 2
For task one, you need to complete the following:
Download and finish the data table by calculating the missing data.
Graph the scatter plot. Use the latitude as the horizontal variable and the average temperature as the vertical. See the tips and tricks section for tips!
Calculate and graph the linear regression line (line of best fit). Make sure to include the equation. Include a step-by-step explanation on how you found the line of best fit.
Write a summary of your process that includes the following details.
Do you feel that there is a linear relationship between a location's latitude and the average temperature? Support your reasoning with at least three pieces of evidence from the data.
Outliers are points that do not fit the trend of the data. Identify a place you think is an outlier. Why do you think this location does not fit in the trend of the data? You may have to do additional research on this location.
Informationen
- Beschreibung
- Grade 8 Algebra Notiz am Unit 5 Project: It's Cold Outside!, erstellt von Ava Kushion am 13/08/2020.
- Erstellt von
- Ava Kushion · Aug 2020
- Aktualisiert
- 13 Aug 2020
- Aufrufe
- 0
- Bewertung