
Flashcards
stats test 2
Cards in this deck (76)
- 1the measure of center (average)mean
- 2how to compute the mean1. add all the numbers
2. divide the sum by the number of observations - 3a number that splits the data set in half, so that half the data values are less and half are moremedian
- 4step 1: arrange that data values in increasing order step 2: determine the numbers of data values, n step 3: if n is odd: the median is the middle number If n is even: the median is the average of the two numbershow to compute the median
- 5a value that appears most frequentlymode
- 6rules for modes:*the mode of a data set is the number that appears most frequently
*if two or more values are tied for the most frequent, they are all considered to be modes
*if the values all have the same frequency, there is no. mode - 7the __ of a data set is the difference between the largest value and the smallest valuerange
- 8formula for computing the range:range= largest value- smallest value
- 9the __ is a measure of how far the values in a data set are from the mean on averagevariance
- 10the __ __ __ s is the square root of the sample variance s^2.sample standard deviation
- 11sample standard deviation formula:s = square root of s^2
- 12when a data set has a bell-shaped histogram, it is often possible to use the standard deviation to provide an approximate description of the data using a rule known as the __.the empirical rule
- 13the empirical rules states:* approximately 68% of the data will be within one standard deviation of the mean
*approximately 95% of the data will be within two standard deviations of the mean
*All, or almost all, of the data will be within three standard deviations of the mean - 14when a distribution is bell-shaped, the empirical rule gives us an approximation to the proportion of data that will be within one or two standard deviations of the meanchebyshev's inequality
- 15rules for chebyshev's inequality*at least 3/4 (75%) of the data will be within two standard deviations of the mean
*at least 8/9 (88.9%) of the data will be within three standard deviations of the mean - 16the __ tells how large the standard deviation is relative to the meancoefficient of variation
- 17the coefficient of variation is found by ___dividing the standard deviation by the mean or
- 18the __ of an individual data value tells how many standard deviations that value is from the population meanz-score
- 19let x be a value from a population with meanthe formula is .
(on formula chart) - 20when a population has a histogram that is approximately bell-shaped then,*approximately 68%of the data will have z-scores bw -1 and 1
*approx. 95% of the data will have z-scores bw -2 and 2
* all, or almost all, of the data will have z-scores bw -3 and 3 - 21__ divide a data set into four approximately equal piecesquartiles
- 22procedure for computing the quartiles of a data set:step 1: arrange the data in increasing order
step 2: for the first quartile, compute L=0.25n
""third "' L=0.75n
step 3: if L is a whole number, the quartile average of the number in position L and the number in position L+1
If L is not a whole number, round up to the next whole number - 23__ divide a data set into hundredthspercentiles
- 24procedure for computing the data value corresponding to a given percentilestep 1: arrange the data into increasing order
Step 2: L= p/100 X n
step 3: if L is a whole number, it is the average of L and L+1
if L is not a whole number, round up - 25an __ is a value that is considerably larger and considerably smaller than most of the data in the value setoutliers
- 26the __ is a measure of spread that is often used to detect outliersinterquartile range
- 27the interquartile range is found by:subtracting the first quartile. by the third quartile
IQR= Q3-Q1 - 28a __ is a graph that presents the five number summary along with some additional information about a data setbox plot
- 29procedure for constructing a box plot:step 1: compute the 1st , 3rd quartiles and median
2: draw vertical lines at the 1st quartile, the median, and 3rd quartile, & long line to box
3: compute upper & lower boundaries
4: find the whisker
5: draw the whisker
6: determine if there are any outliers. plot them - 30the __ of an event is the proportions of times the event occurs in the long run, as the ___ experiment is repeated over and over againprobability
- 31a __ contains all the possible outcomes of a probability experimentsample space
- 32describe a sample space for the roll of a die:the sample space can either be 1,2,3,4,5, or 6
- 33the ___ consists of repeating an experiment a large number of times, and using the proportions of times an outcome occurs to approximate the probability of the outcomeempirical method
- 34an __ is one whose probability is smallunusual event
- 35the Centers for Disease Control and Prevention reports that in the year 2010, there were 2,04,935 boys and 2,952,451 girls born. Approximate the probability that a newborn baby is a boy.1: 2,046,935 + 2,952,451 = 3,999,386 births
2: divide 2,046,935 by 3,999,386 = 0.5118 - 36a __ categorizes people with regard to two variablesa contingency table
- 37the general addition rule: for any two events A and BP(A or B) = P(A) + P(B) - P(A and B)
- 38two events are said to be __ if it is impossible for both events to occurmutually exclusive
- 39if A is and event, the __ of A is the event that A does not occurcomplemnet
- 40the complement of A is _A^c
- 41the general method for computing conditional probabilities:the probability of B given A is:
- 42the general multiplication rule :Or can be inverse
- 43two events are said to be __ if the occurrence of one does not affect the probability that another event occursindependent
- 44if tow events are not independent, we say they are __dependent
- 45using the multiplication rule for independent events:P(N and C and L) = P(N) X P(C) X P(L)
- 46* if an operation can be performed in M ways, & a second operation can be performed in N ways, then the total number of ways that the operation can be performed is MNthe fundamental principles of counting
- 47if a sequence of several operations is to be performed, the number of ways to perform the sequence is found by multiplying together the number of ways to perform each of the operationsthe fundamental. principles counting
- 48orderingpermutations
- 49n! =n (n- 1) ... (2) (1)permutations
- 50each distinct group of objects that can be selected, without regard to ordercombination
- 51the number of combinations of r objects chosen form group of n objects isnCr = n!/ r!9n-r)1
- 52Of the mean, median and mode, which must be a value that appears in the data set ?the mode
- 53the prices (in dollars) for a sample of personal computers are 550,700,420,580,550,450,690,39,350. calculate the mean, median, and mode for this sample.mean: 520
median: 550
Mode: 550 - 54If a computer with the price of $200 were added to 550, 700, 420, 580, 550, 450, 690, 390, 350, which would be affected more, the mean or the median?the mean
- 55In a general, a histogram is skewed to the eft if the __ is noticeably less than the __mean, median
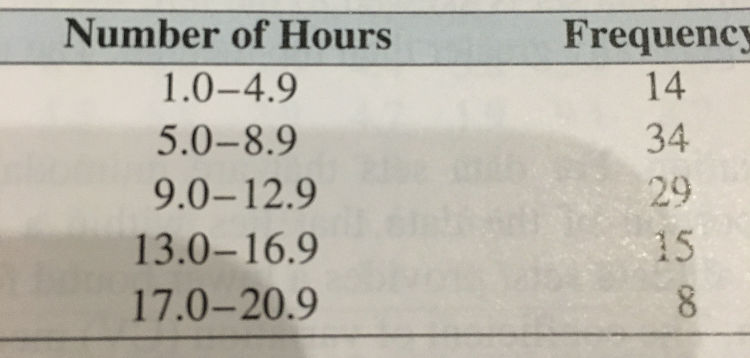
- 56Approximate the mean time this sample of students spent studying9.76
- 57Approximate the standard deviation of the time this sample of students spent studying4.51
- 58A sample has a variance of 16. What is the standard deviation4
- 59Mean : 37480// Standard deviation: 1,400 Assume the histogram of starting salaries is approximately bell-shaped. Approximately what percentage of the salaries will be between 34,680 and 40,28095%
- 60Mean: 37480// SD: 1,400 Assume it is not known whether the histogram of starting salaries is bell-shaped. At least __ percent of the salaries will be between 34,680 and 40,28075
- 61M: 37480// SD: 1,400 John's starting salaries is 38,180. What is the z-score of his salary?0.5
- 62M: 37480// SD: 1400 Find the coefficient of variation of the salaries?0.037
- 63T or F: If a student's exam grade is on the 55th percentile, then approximately 45% of the scores are below his or her grade.False
- 64The five number summary for a sample is 7, 18, 35, 62, 85. What is the IQR?44
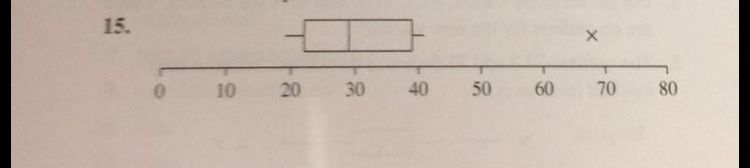
- 65AQ1 = 22
Q3 = 39
- 66BOutlier boundaries are -3.5 and 64.5
- 67C68 is the only outlier
- 68Construct a box plot
- 69The probability that a fair coin lands heads is 0.5. Therefore, we can be sure that if we toss a coin repeatedly, the proportions of times it will lands heads will ___ a) approach 0.5 B) be equal to 0.5 C) be greater than 0.5 D) be less than 0.5A
- 70Identify the sample spacethe population of one million voters
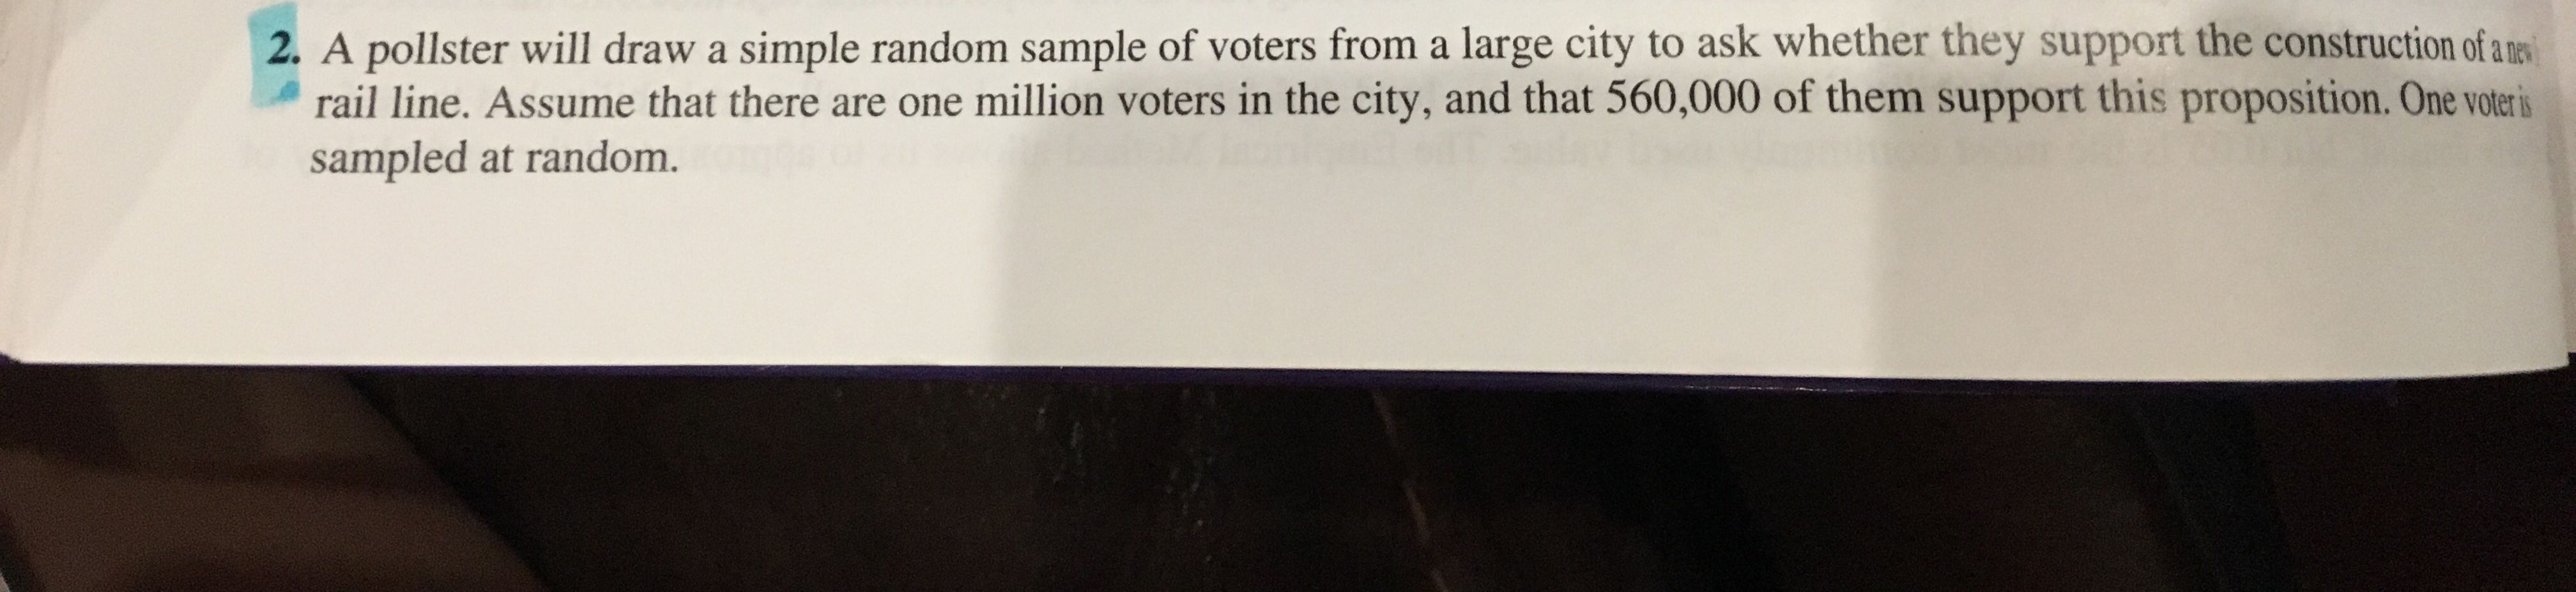
- 71what is the probability that the sampled voter supports the light rail line?0.56
- 72what the general addition rule?P(A or B) = P(A) +P(B) - P(A and B)
- 73addition rule for mutually exclusive eventsP(A and B)= P(A) +P(B)
- 74rule of complementsP(A^c) =1-P(A)
- 75multiplication rule for independent eventsP(A and B) = P(A) P(B)
- 76—
Information
- Description
- Science Flashcards on stats test 2 , created by Destini Maness on 01/10/2017.
- Created by
- Destini Maness
- Views
- 2
- Rating