
Flashcards
3.3.2: Understanding markets and customers
Cards in this deck (28)
- 1Understanding the Market: (Is it a...)-Local market (local area it operates in)
-National market (across the country)
-International market (overseas)
-Physical market (physical)
-Electronic market (online) - 2Understanding the Market: (is the market...)-New
-Growing
-Saturated
-Seasonal
-B2B (business to business)
-B2C (business to consumer) - 3What Do You Want To Find Out:-target audience
-price points
-competitors
-likely demand - 4Market Analysis: (what do they need to analyse)market size
market trends
sales growth
market growth
market share
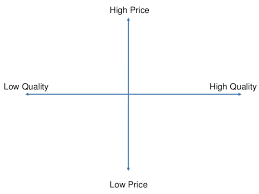
market mapping - 5Market Mapping:compares two key features of products or trends that are important to customers e.g. price & quality
(to see potential gaps in market and to compare their products to rivals) - 6Market Mapping:-identifies gaps
-where close competitors are
-how many competitors there are - 7Market Research:The collection, analysis and evaluation of data
Quantitative: collection of numerical data
Qualitative: more human data (opinions/ideas/attitudes/feelings) - 8Types of Market Research: (Primary)new information gathered first hand by the business itself
Methods:
-questionnaires
-surveys
-interviews
-observations
-focus groups
Advantages:
-reliable (specific to business/product itself)
-time (up to date)
Disadvantages:
-might be expensive
-interviewer bias - 9Types of Market Research: (Secondary)existing data and information gathered by someone else
Methods:
-internet (online research)
-books
-reports/studies (specific to business)
-government publications
-newspapers
-reviews
Advantages:
-less time consuming
-extensive (large sample)
Disadvantages:
-could be inaccurate/out of date - 10Sample:a group of respondents whose views, characteristics and behaviour represent the overall target market. a representative sample is required (similar characteristics e.g. age, income, gender, geography)
- 11Sampling Methods:Random sampling:
-anyone/everyone has equal chance of selection
-respondents picked at random
Quota sampling (most useful):
-respondents represent your target market
Stratified sampling:
-population is divided into groups (strata's)
-respondents selected randomly - 12Choice of Sampling Method/Size:Depends on:
-time
-cost
-stage of life cycle (new/existing product)
-market position (mass/niche)
target audience and their characteristics - 13Advantages/Disadvantages of Sampling:Advantages:
-Keeps costs down
-saves time
Disadvantages:
-hard to get representative sample
-interviewer bias may occur - 14Interviewer Bias:Dark/Milk chocolate:
(None) Do you prefer dark or milk chocolate?
(Irrelevancy) What's your favourite type of chocolate?
(Bias) My favourite is milk chocolate, what's yours? - 15The Key to Valuable/Reliable Market Research:-representative of target market
-large enough sample size
-free from interviewer bias - 16Interpreting Market Data:-Correlation: how closely two variable link (positive/negative/no correlation, line of best fit)
-Confidence intervals: a margin of error for sample results (the more representative the sample, the greater the confidence level, smaller interval)
-Extrapolation: continuing past patterns or trends into the future (predicting sales trends based on past data) - 17Correlation Examples:+Research & development spending, innovation (no. new product launches)
+Staff training, productivity/customer service quality
+Consumer income, sales
-Price increases, demand - 18Coefficient of Correlation:Positive (+!)
Inbetween weaker and stronger correlation
Negative (-1) - 19Using IT to Analyse Market Data:Advantages:
-processed/analysed quickly
-construct customer databases
Disadvantages:
-trends could be misunderstood
-hard to analyse lots of information - 20Price Elasticity of Demand: (PED)the degree to which demand will change in response to a change in price
% change in quantity demanded / % change in price = PED
*>1 = ELASTIC (demand changes with price) e.g. chocolate
*<1 = INELASTIC (demand relatively unresponsive to price) e.g. cigarettes - 21Price-Elastic Product:-Characteristic: undifferentiated (many competitors)
-Price cut: sales rise, revenue rises
-Numerically: between -1 & -5 or more
Price rise: sales fall, revenue falls - 22Price-Inelastic Product:Characteristic: Differentiated (few competitors)
Price cut: sales rise but not much so revenues fall
Numerically: between -0.1 & -0.99
Price rise: sales fall but not by much so revenue rises - 23Extra Points:-If there is no direct competition, PED is lower meaning the price can be pushed up without losing too many customers
-low price elasticity if there is high brand loyalty e.g. Coca Cola - 24Why know PED:-part of market analysis
-identify how changes in price affect demand
-forecast future demand in relation to price changes - 25% Change:(original figure - new figure / original figure) x100 = % change
- 26Income Elasticity of Demand: (IED)the measure of what degree demand will change in response to change in consumer income
% change in quantity demanded / % change in income
*>1 = ELASTIC (demand changes with income) luxury goods e.g. holidays
*<1 = INELASTIC (demand doesn't really change with income) necessities e.g. bread, milk
*Unitary = income change is cancelled out by demand change - 27Inferior Goods:negative figure as demand will fall as income increases e.g. own brands are replaced with branded goods
- 28Test Marketing:replicates all elements of a product launch to provide feedback of success without wasting a huge amount of money in investment
Benefits:
-sales results can be used to inform decisions
-minimise risk as less cost wastage
-generate feedback
Drawbacks:
-tastes in one area may not represent whole market
-can be costly and time consuming
-might give competitors time to respond
Information
- Description
- Understanding markets, marketing analysis, market mapping, market research (quantitative/qualitative/primary/secondary), sampling, interpreting market data, IT for marketing, PED & IED, inferior goods, % change, test marketing
- Created by
- Ashleigh-Jade Jones
- Views
- 46
- Rating