
Flashcards
Analytics W4
Cards in this deck (32)
- 1What is a regression line?the line that best fits the data points on a graph - the regression line
is the line that minimizes the dispersion of points around that line - 2How does one measure the accuracy of a regression line?we measure the accuracy of the regression line by measuring that dispersion of points around that line
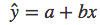
- 3In general, a single variable regression line can be described by the equation:
- 4a is the ___? b is the ___?a: the y-intercept of the line
b: slope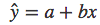
- 5What is E.? (eqn & explanation)The error term is the difference between the actual value of y and the expected value of y.


- 6Instead of predicting a single point, we can construct a _______ interval, an interval around the point forecast that is likely to contain, for example, the actual selling price of a house of a given size.prediction
- 7The width of a prediction interval varies based on the: (x3 things)1. standard deviation of the regression (the standard error of the regression)
2. the desired level of confidence, and
3. the location of the x-value of interest in relation to the historical values of the independent variable. - 8As the confidence level increases, the:width of the prediction interval increases.
- 9the width of the prediction interval increases as...we move to the edge of, and beyond, the range of historical data,
- 10We call the vertical distance between a data point and the regression line ....the residual error
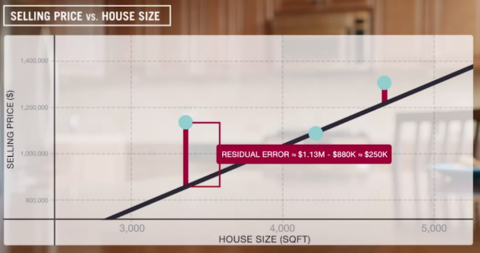
- 11What is a residual error?This error is the difference between the observed value and the line's prediction for the dependent variable.
- 12Formal definition of regression line?A regression line is formally defined
as the line that minimizes the sum of squared errors. - 13Sum of squared errors how to calculate?When we take the square of each distance (b/w reg line & actual value)
and then add all of those squared terms together. - 14dependent variable - which axis?y axis
- 15To find out how much additional value the regression model gives us, we'll compare the accuracy of the _______ with that of the _______regression line
mean price line - 16Define The Residual Sum of Squaresthe amount of variation that is left unexplained by the regression line, that is, the sum of the squared differences between the predicted and observed values.
- 17the sum of squared errors for the mean price line is called:the total sum of squares.
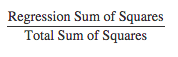
- 18total sum of squares - residual sum of squares =the regression sum of squares.
- 19What does R2 (pronounced R-squared) measure?how closely a regression line fits a data set.
- 20What is the equation for R^2?
- 21In single variable linear regression, i.e. a regression model that has only one independent variable, R2 is:the square of the correlation coefficient between the independent and dependent variables.
- 22What are the 2 parameters, in addition to R-squared, should we look to for further insight?1. the p-value of the independent variable 2. the residual plot.
- 23if we can show that the slope of the true regression line is not zero,we can be confident
that there is a significant linear relationship. - 24What is the hypotheses to test whether the linear relationship is significant of the reg line? null hypothesis: hypothesis:null hypothesis:
the true slope of the regression line is zero
the alternative hypothesis:
the true slope is not zero. - 25There are two ways to test whether the slope of the best fit line equals zero. Name them1. Check whether the confidence interval for the line's slope contains zero
2. Check whether the p-value is greater than or equal to 0.05 - 26What are the implications if the best fit regression line has a slope of zero?this means that the regression line is just a flat line = to the mean of the dependent variable.
there is no linear relationship between the 2 variables. - 27What is heteroscedasticityIf the residuals become larger as we move along the x-axis.
In heteroscedastic relationships, the variance changes systematically
as the independent variable changes. - 28When there are no systematic patterns in the residual plot..... (2 things)1. there is a linear relationship
between the dependent and independent variables
and
2. the assumptions underlying regression analysis hold - 29What is the net effect?The net effect controls for all other factors (independent variables) included in the regression model.
- 30the effect of an independent variable on a dependent variable in a single variable linear regression model can be described as a: ___________ relationshipgross
- 31What does a gross relationship mean? Independent variable - x Dependent variable - ySince no other independent variables are included in the model, the coefficient for y may pick up the effect of other factors related to x
- 32Coefficients in multiple regression are ____ with respect to variables included in the model and ____ with respect to variables that are omitted from the model.net; gross
Information
- Description
- Professional Harvard CoRE (Business Analytics) Flashcards on Analytics W4, created by Georgia Tan on 28/07/2015.
- Created by
- Georgia Tan
- Views
- 1
- Rating