
Mind map
Statistics
Map content
Statistics
Basic Concepts
- Random variables
- Quantitative
- Continuous
- Discrete
- Qualitative
- Quantitative
- Random variables
Measurement Scales
- Nomimal
- Values assigned to variables represent a descriptive category, but have no inherent numerical value with respect to magnitude.
- Properties: Identiy
- Ordinal
- Each value on the ordinal scale has a unique meaning, and it has an ordered relationship to every other value on the scale.
- Properties: Identity and Magnitude
- Interval
- With an interval scale, you know not only whether different values are bigger or smaller, you also know how much bigger or smaller they are.
- Properties: Identity, magniyude and equal intervals
- Ratio
- Each value on the weight scale has a unique meaning, weights can be rank ordered, units along the weight scale are equal to one another, and the scale has a minimum value of zero.
- Properties: Identity, magnitude, equal intervals and minium value of zero
- Nomimal
Sampling Methods
- Not probability samples
- With non-probability sampling methods, we do not know the probability that each population element will be chosen, and/or we cannot be sure that each population element has a non-zero chance of being chosen.
- voluntarie
- A voluntary sample is made up of people who self-select into the survey.
- Convenience
- A convenience sample is made up of people who are easy to reach.
- Probability samples
- With probability sampling methods, each population element has a known (non-zero) chance of being chosen for the sample.
- Simple random
- With multistage sampling, we select a sample by using combinations of different sampling methods.
- Systematic Random
- With systematic random sampling, we create a list of every member of the population. From the list, we randomly select the first sample element from the first k elements on the population list. Thereafter, we select every kth element on the list.
- Clutser
- With cluster sampling, every member of the population is assigned to one, and only one, group.
- Stratified
- With stratified sampling, the population is divided into groups, based on some characteristic.
- Not probability samples
Visual displays of data
- Frecuency Distribution
- Frecuecy
- When a data includes many repeated items.
- Relative Frecuency
- This is the fraction or percentage of data set represented by the item.
- Frecuecy
- DISPLAYS
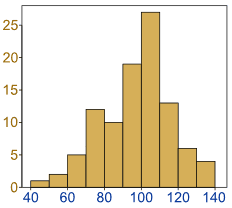
- Histogram
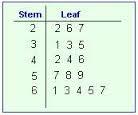
- Steam and Leaf
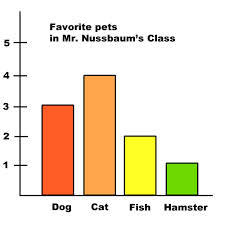
- Bar Graphs
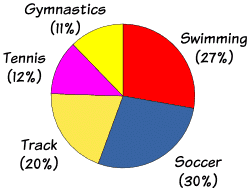
- Circle Graphs
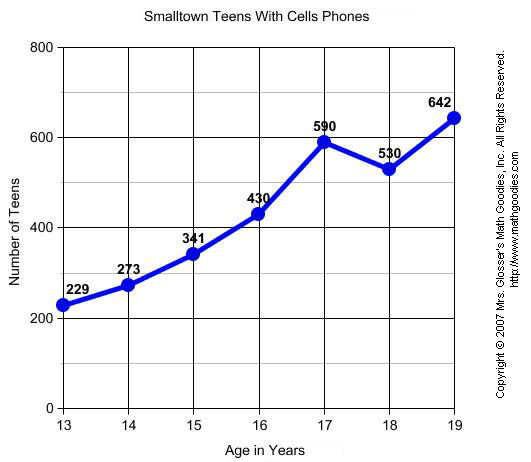
- Line Graphs
- Histogram
- Frecuency Distribution
Measures
- Measures of Central Tendency
- Mean
- Weighted mean
- Mode
- The mode of data set is the value that occurs most often.
- Measures of Dispersion
- Range
- Chebyshev's teorem
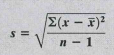
- Standard derivation
- Coefficient of variation
- Measures of Central Tendency
Images and files in the map


Information
- Description
- Mind Map on Statistics, created by Lesly San Juan on 26/08/2014.
- Created by
- Lesly San Juan
- Views
- 20
- Rating