
Mind map
Statistics
Map content
Statistics
Measurement Scales
- QUALITATIVE-Nominal: identity property. Values assignes to variables represent a descriptive category, they have no inherent numerical value with respect to magnitude
- Gender, religion, cellphone number
- QUAL-Ordinal: identity and magnitude properties. Each value on the ordinal scale has an unique meaning, an ordered relationship to every other value on the scale
- Results of horse race, how do you feel today?
- QUANT-Interval: identity, magnitude, equal intervals properties. To know if different values are bigger or smaller also how much bigger or smaller are.
- Fahrenheit scale, time of the day on 12 hrs clock
- QUANTITATIVE-Ratio: identity, magnitude, equal intervals and minimum value of zero identities
- weight of an object, distance in inches, math class grade, temperature in K, cost in euros
- QUALITATIVE-Nominal: identity property. Values assignes to variables represent a descriptive category, they have no inherent numerical value with respect to magnitude
Sampling Methods
- Probability
- Simple: Random
- Systematic: choose according to a rule
- Stratified: groups chosen
- Cluster: grabbing elements according to some rule
- Non-Probability
- -Quota: elements but not randomly chosen
- Convenience
- Probability
Visual Displays of Data
- Frecuency Distribution
- Frecuency: Times an event happens
- Relative Frecuency: frecuency over total elements in %
- Data set with large #'s: Grouped Frecuency Distribution
- 1.Make sure each data item will fit in 1 class
- Data: lower class limits upper class limits, class width, class mark
- 2. Try to make all classes, same width
- 3.Make sure classes don't overlap
- 4.Use 5-12 classes
- Displays
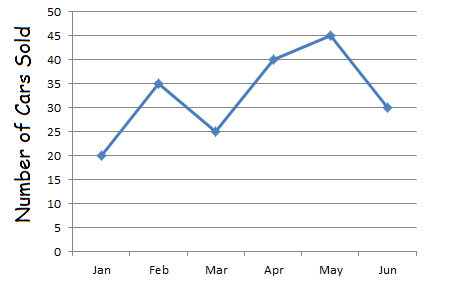
- Line Graph(how quantity changes respect something)
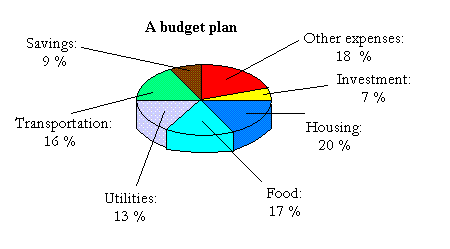
- Circle Graph (represent total of categories in sections to show magnitudes)
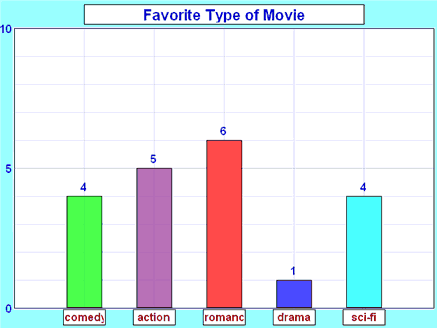
- Bar Graphs(frecuency distribution of non-numerical observations)
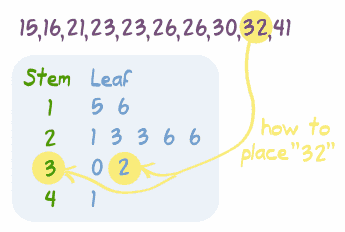
- Stem and Leaf (numbers grouped, help with big quantities)
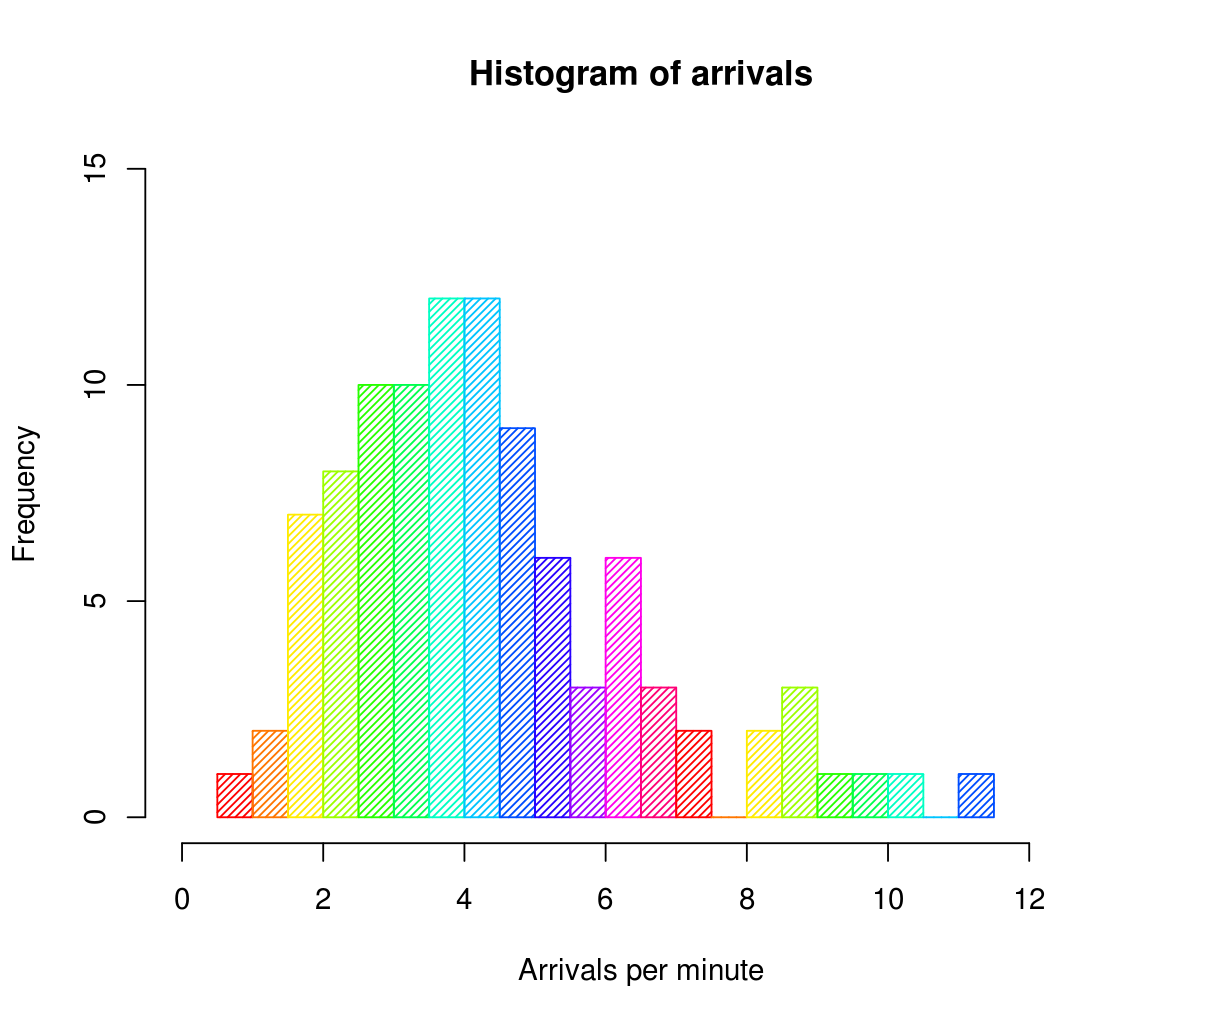
- Histogram(display of data using bars, groups #'s into ranges
- Frecuency Distribution
Measures of Central Tendency
- Mean
- -x-(sample) N(population). Addition of all items and then divide this into the # of items
- -x-=Ex/n
- -x-(sample) N(population). Addition of all items and then divide this into the # of items
- Weighted mean
- -w-=E(x.f)/Ef
- Sum of all products of items by weighting factors, divided by the sum of all weighting factors
- -w-=E(x.f)/Ef
- Mode
- Value that occurs more often
- Median
- 1.Rank items (least to greates)2. If # is odd, median is at the middle 3.Even #, median is mean of 2 middle items
- =n+1/2=Ef+1/2
- Mean
Measures of Dispersion
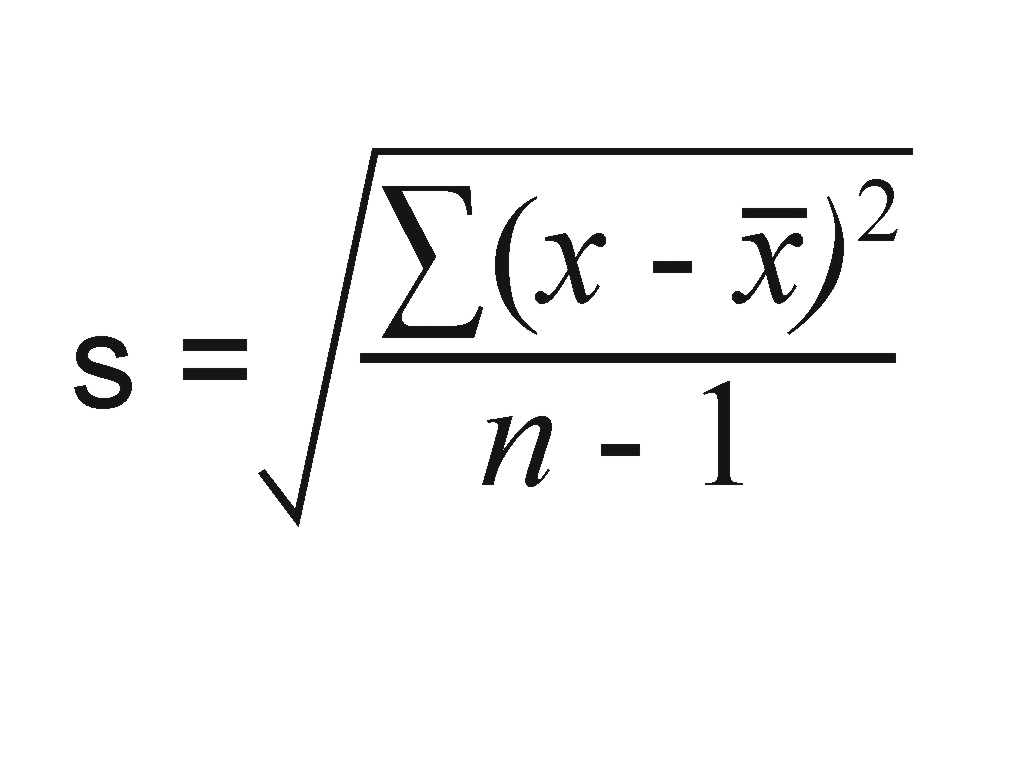
- Standard deviation: based on deviations from mean of data values
- Calculate -x-, mean of #'s; Find deviations from -x-; Square each deviation; Sum squared deviations; Divide sum by n-1; Square root of quotient
- Chevyshev's Teorem: for any set of #'s regardless their distribution, their fraction that lies within K stand. dev. of their mean is at least
- 1-1/k^2
- K=# of stand. dev.
- 1-1/k^2
- Range: greatest value-lowest value
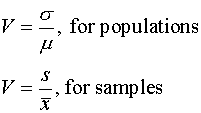
- Coefficient of Variation
- Standard deviation: based on deviations from mean of data values
Measures of position
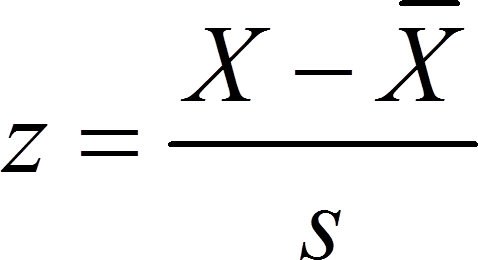
- z-score(standard score)
- Decile
- Quartile
- Percentile
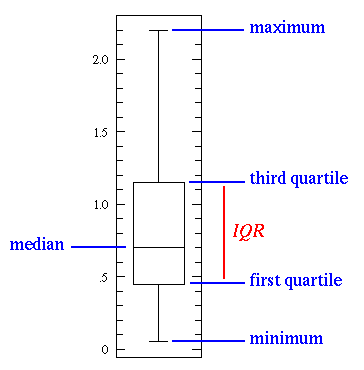
- Box Plot
Statistics:search, analize, interpret data
- Descriptive:recopilation of data
- Inferential: conclusions from data
- population: whole data
- Sample: part of population
- Random variables
- Qualitative
- no numbers
- Quantitative
- Discrete(counting)
- Continuous(measure)
- Qualitative
Images and files in the map
Information
- Description
- Mind Map on Statistics, created by Cinthya Virelas on 27/08/2014.
- Created by
- Cinthya Virelas
- Views
- 13
- Rating