
Mind map
Hypothesis testing
Map content
Hypothesis testing
things to know
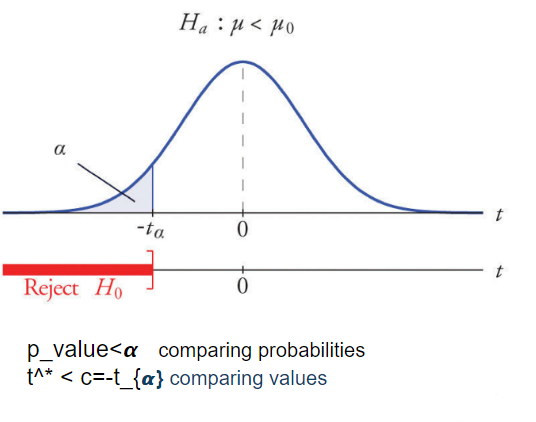
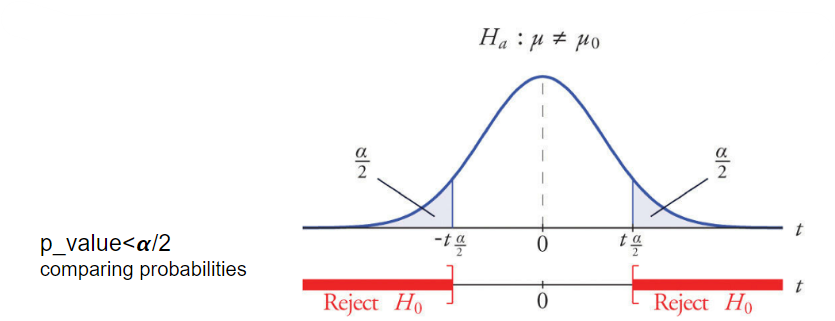
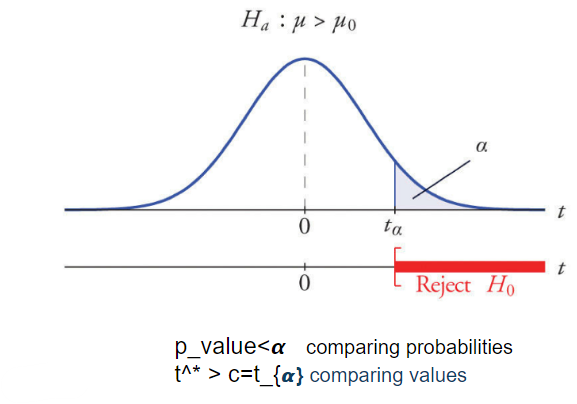
- Graph representations
- Steps for Hypothesis testing
- 1) Choose the null and alternative hypotheses
- Null Hypothesis (Ho)
- a population parameter
- a statement
- being equal to some value
- Alternative Hypothesis (H1)
- contrary to null hypothesis
- Null Hypothesis (Ho)
- 2) Choose a significance level
- α
- probability rejecting Ho (α = P (reject Ho| Ho true))
- α
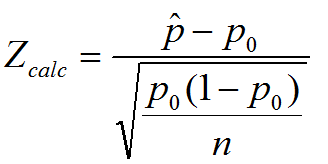
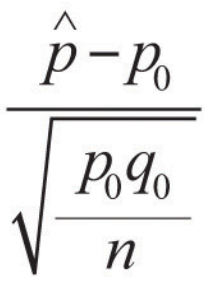
- 3) Calculate the test statistics
- z / t / x2
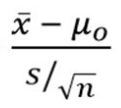
- Test statistic = (point estimate - null value) / Standard Error
- ...
- Test statistic = (point estimate - null value) / Standard Error
- z / t / x2
- 4) Calculate the p value
- the area under the sampling distribution
- P(the observed sample outcome|H_0 true) = P(X>c| H_0 true), c = critical value
- extreme in the direction of the alternative hypothesis
- 5) State a conclusion
- If p-value < α, reject null hypothesis
- If p-value > α, do not reject null hypothesis
- 1) Choose the null and alternative hypotheses
- Graph representations
types of test
- t - test
- Degrees of freedom: n - 1
- for one mean
- for two means
- paired data: taking data twice
- unpaired data: taking data from different groups
- watch pooled/not pooled
- S1 and S2 are similar, and if S1 (the biggest one) < 2 · S2 then it's pooled
- type I error
- the test result says you have coronavirus, but you actually don’t (false positive)
- P (reject Ho|Ho true)
- the test result says you have coronavirus, but you actually don’t (false positive)
- type II error
- the test result says you don’t have coronavirus, but you actually do (false negative)
- P (accept Ho | Ho false)
- the test result says you don’t have coronavirus, but you actually do (false negative)
- Chi squared goodness of fit
- • The data is from a multinomial experiment. • All expected values are at least 5. (Another rule of thumb is that there are more than 4 groups, the average of the expected values is at least 5, and the smallest expected value is at least 1.)
- to see of the data fits a distribution
- degrees of freedom: k - 1 , k= the number of groups or cells in the contingency table.
- Chi-squared test for independence / Goodness of fit
- • The data is multinomial data in a contingency table or two way cross-classification table. • All expected values are at least 5. (Another rule of thumb is that there are more than 4 cells, the average of the expected values is at least 5, and the smallest expected value is at least 1.) • The cells have counts or frequencies. It doesn't work if the data is percentages or relative frequencies! • The data comes from one population.
- degrees of freedom: df = (rows − 1) (columns − 1)
- used to see if two variables are independent.
- z - test
- t - test
Images and files in the map
Information
- Description
- Mates Mind Map on Hypothesis testing, created by Lua de Torres Ezcurra on 01/11/2022.
- Created by
- Lua de Torres Ezcurra · Nov 2022
- Updated
- Nov 10, 2022
- Views
- 0
- Rating