
Mapa mental
MIGRATION
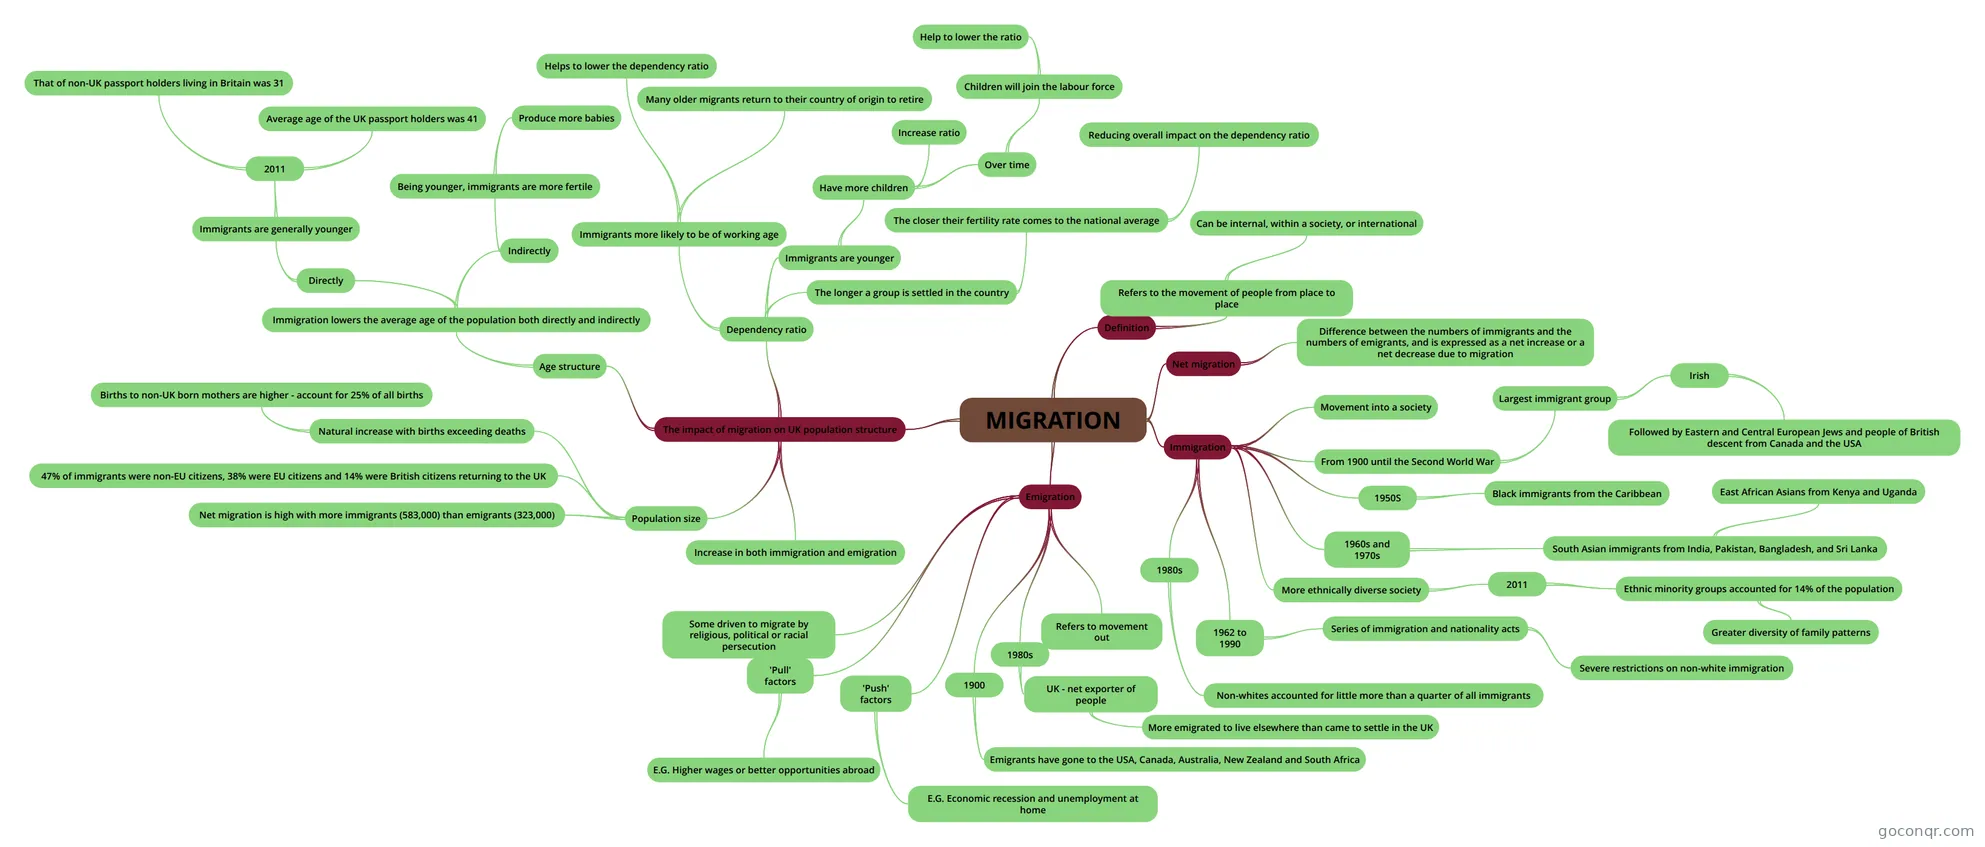
Mind map: Migration
Contenido del mapa
MIGRATION
Definition
- Refers to the movement of people from place to place
- Can be internal, within a society, or international
- Refers to the movement of people from place to place
Net migration
- Difference between the numbers of immigrants and the numbers of emigrants, and is expressed as a net increase or a net decrease due to migration
Immigration
- Movement into a society
- From 1900 until the Second World War
- Largest immigrant group
- Irish
- Followed by Eastern and Central European Jews and people of British descent from Canada and the USA
- Irish
- Largest immigrant group
- 1950S
- Black immigrants from the Caribbean
- 1960s and 1970s
- South Asian immigrants from India, Pakistan, Bangladesh, and Sri Lanka
- East African Asians from Kenya and Uganda
- South Asian immigrants from India, Pakistan, Bangladesh, and Sri Lanka
- More ethnically diverse society
- 2011
- Ethnic minority groups accounted for 14% of the population
- Greater diversity of family patterns
- Ethnic minority groups accounted for 14% of the population
- 2011
- 1962 to 1990
- Series of immigration and nationality acts
- Severe restrictions on non-white immigration
- Series of immigration and nationality acts
- 1980s
- Non-whites accounted for little more than a quarter of all immigrants
Emigration
- Refers to movement out
- 1980s
- UK - net exporter of people
- More emigrated to live elsewhere than came to settle in the UK
- UK - net exporter of people
- 1900
- Emigrants have gone to the USA, Canada, Australia, New Zealand and South Africa
- 'Push' factors
- E.G. Economic recession and unemployment at home
- 'Pull' factors
- E.G. Higher wages or better opportunities abroad
- Some driven to migrate by religious, political or racial persecution
The impact of migration on UK population structure
- Increase in both immigration and emigration
- Population size
- Net migration is high with more immigrants (583,000) than emigrants (323,000)
- 47% of immigrants were non-EU citizens, 38% were EU citizens and 14% were British citizens returning to the UK
- Natural increase with births exceeding deaths
- Births to non-UK born mothers are higher - account for 25% of all births
- Age structure
- Immigration lowers the average age of the population both directly and indirectly
- Directly
- Immigrants are generally younger
- 2011
- Average age of the UK passport holders was 41
- That of non-UK passport holders living in Britain was 31
- 2011
- Immigrants are generally younger
- Indirectly
- Being younger, immigrants are more fertile
- Produce more babies
- Being younger, immigrants are more fertile
- Directly
- Immigration lowers the average age of the population both directly and indirectly
- Dependency ratio
- Immigrants more likely to be of working age
- Helps to lower the dependency ratio
- Many older migrants return to their country of origin to retire
- Immigrants are younger
- Have more children
- Increase ratio
- Over time
- Children will join the labour force
- Help to lower the ratio
- Children will join the labour force
- Have more children
- The longer a group is settled in the country
- The closer their fertility rate comes to the national average
- Reducing overall impact on the dependency ratio
- The closer their fertility rate comes to the national average
- Immigrants more likely to be of working age
Información
- Descripción
- A level (DEMOGRAPHY) Sociology Mapa Mental sobre MIGRATION, creado por Inayah Motin el 01/09/2017.
- Creado por
- Inayah Motin
- Visitas
- 3
- Valoración