
Mapa mental
Quality Tools
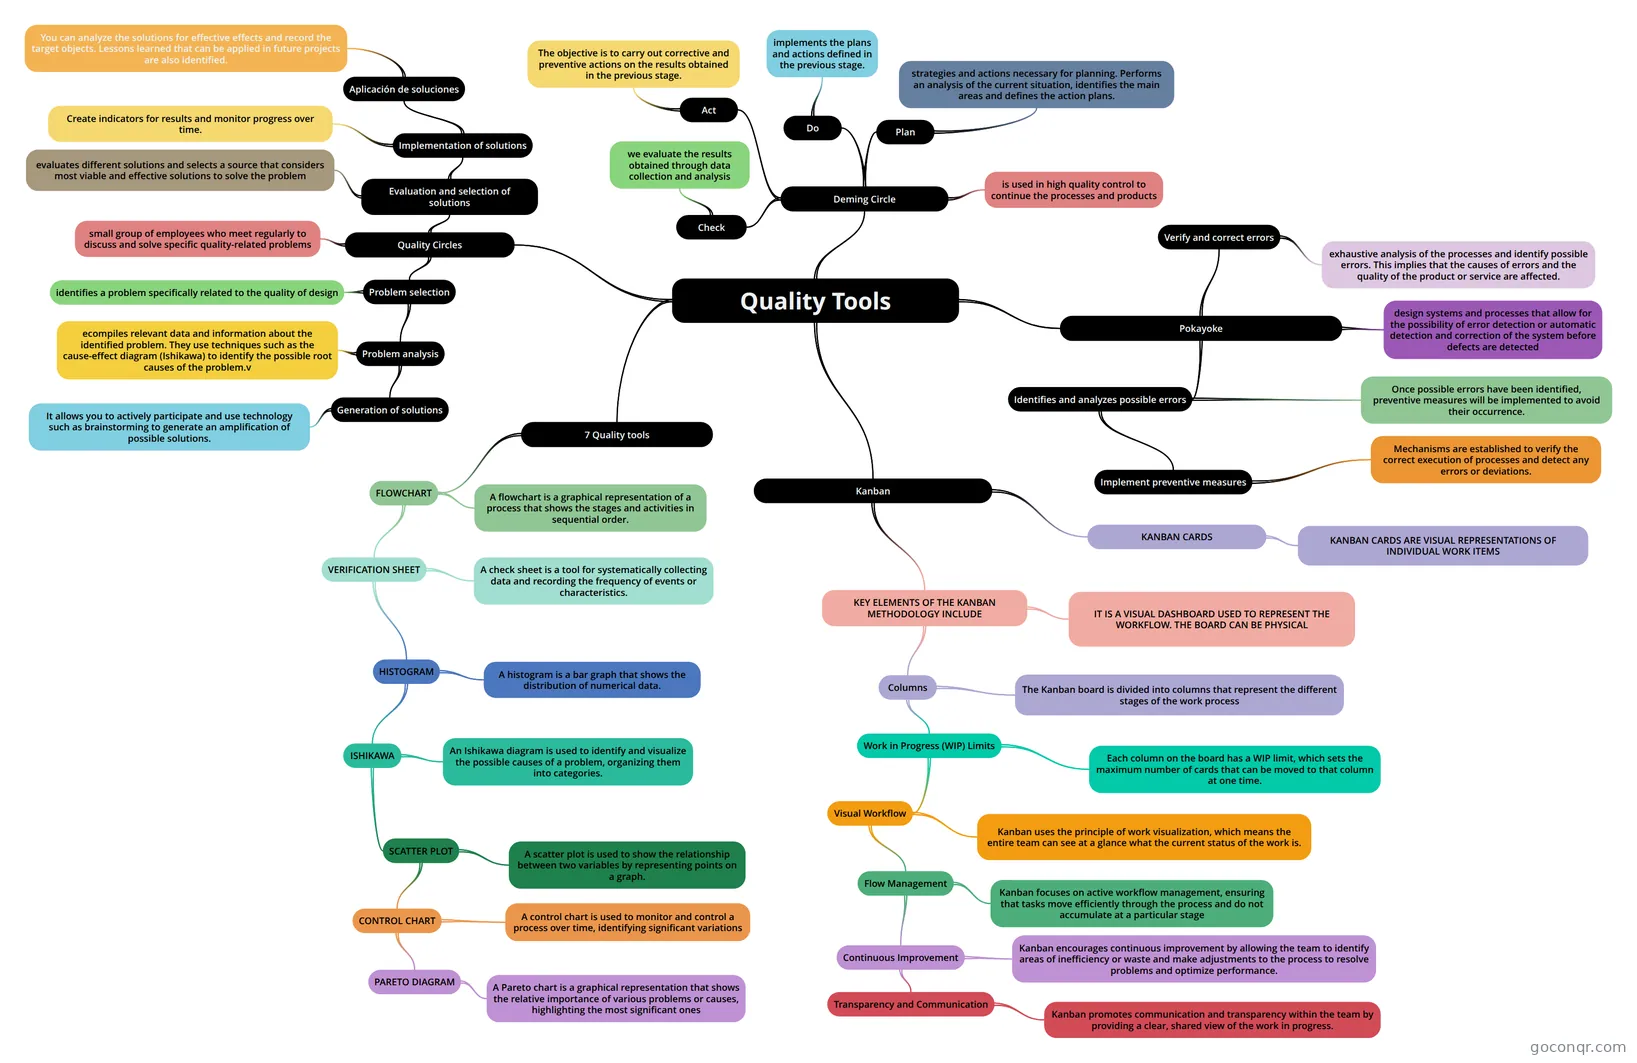
Mind map: Quality tools
Contenido del mapa
Quality Tools
7 Quality tools
- FLOWCHART
- VERIFICATION SHEET
- HISTOGRAM
- ISHIKAWA
- SCATTER PLOT
- CONTROL CHART
- PARETO DIAGRAM
- A Pareto chart is a graphical representation that shows the relative importance of various problems or causes, highlighting the most significant ones
- A control chart is used to monitor and control a process over time, identifying significant variations
- PARETO DIAGRAM
- A scatter plot is used to show the relationship between two variables by representing points on a graph.
- CONTROL CHART
- An Ishikawa diagram is used to identify and visualize the possible causes of a problem, organizing them into categories.
- SCATTER PLOT
- A histogram is a bar graph that shows the distribution of numerical data.
- ISHIKAWA
- A check sheet is a tool for systematically collecting data and recording the frequency of events or characteristics.
- HISTOGRAM
- A flowchart is a graphical representation of a process that shows the stages and activities in sequential order.
- VERIFICATION SHEET
- FLOWCHART
Deming Circle
- is used in high quality control to continue the processes and products
- Plan
- strategies and actions necessary for planning. Performs an analysis of the current situation, identifies the main areas and defines the action plans.
- Do
- implements the plans and actions defined in the previous stage.
- Check
- we evaluate the results obtained through data collection and analysis
- Act
- The objective is to carry out corrective and preventive actions on the results obtained in the previous stage.
Quality Circles
- Problem selection
- Problem analysis
- Generation of solutions
- It allows you to actively participate and use technology such as brainstorming to generate an amplification of possible solutions.
- ecompiles relevant data and information about the identified problem. They use techniques such as the cause-effect diagram (Ishikawa) to identify the possible root causes of the problem.v
- Generation of solutions
- identifies a problem specifically related to the quality of design
- Problem analysis
- Evaluation and selection of solutions
- Implementation of solutions
- Aplicación de soluciones
- You can analyze the solutions for effective effects and record the target objects. Lessons learned that can be applied in future projects are also identified.
- Create indicators for results and monitor progress over time.
- Aplicación de soluciones
- evaluates different solutions and selects a source that considers most viable and effective solutions to solve the problem
- Implementation of solutions
- small group of employees who meet regularly to discuss and solve specific quality-related problems
- Problem selection
Kanban
- KEY ELEMENTS OF THE KANBAN METHODOLOGY INCLUDE
- Columns
- Work in Progress (WIP) Limits
- Visual Workflow
- Kanban uses the principle of work visualization, which means the entire team can see at a glance what the current status of the work is.
- Flow Management
- Continuous Improvement
- Transparency and Communication
- Kanban promotes communication and transparency within the team by providing a clear, shared view of the work in progress.
- Kanban encourages continuous improvement by allowing the team to identify areas of inefficiency or waste and make adjustments to the process to resolve problems and optimize performance.
- Transparency and Communication
- Kanban focuses on active workflow management, ensuring that tasks move efficiently through the process and do not accumulate at a particular stage
- Continuous Improvement
- Each column on the board has a WIP limit, which sets the maximum number of cards that can be moved to that column at one time.
- Visual Workflow
- The Kanban board is divided into columns that represent the different stages of the work process
- Work in Progress (WIP) Limits
- IT IS A VISUAL DASHBOARD USED TO REPRESENT THE WORKFLOW. THE BOARD CAN BE PHYSICAL
- Columns
- KANBAN CARDS
- KANBAN CARDS ARE VISUAL REPRESENTATIONS OF INDIVIDUAL WORK ITEMS
- KEY ELEMENTS OF THE KANBAN METHODOLOGY INCLUDE
Pokayoke
- design systems and processes that allow for the possibility of error detection or automatic detection and correction of the system before defects are detected
- Identifies and analyzes possible errors
- Implement preventive measures
- Mechanisms are established to verify the correct execution of processes and detect any errors or deviations.
- Once possible errors have been identified, preventive measures will be implemented to avoid their occurrence.
- Implement preventive measures
- Verify and correct errors
- exhaustive analysis of the processes and identify possible errors. This implies that the causes of errors and the quality of the product or service are affected.
Información
- Descripción
- Responsable de Cumplimiento Calidad Mapa Mental sobre Quality Tools, creado por zahira GS el 01/11/2023.
- Creado por
- zahira GS
- Visitas
- 0
- Valoración