
Mapa mental
Biodiversity
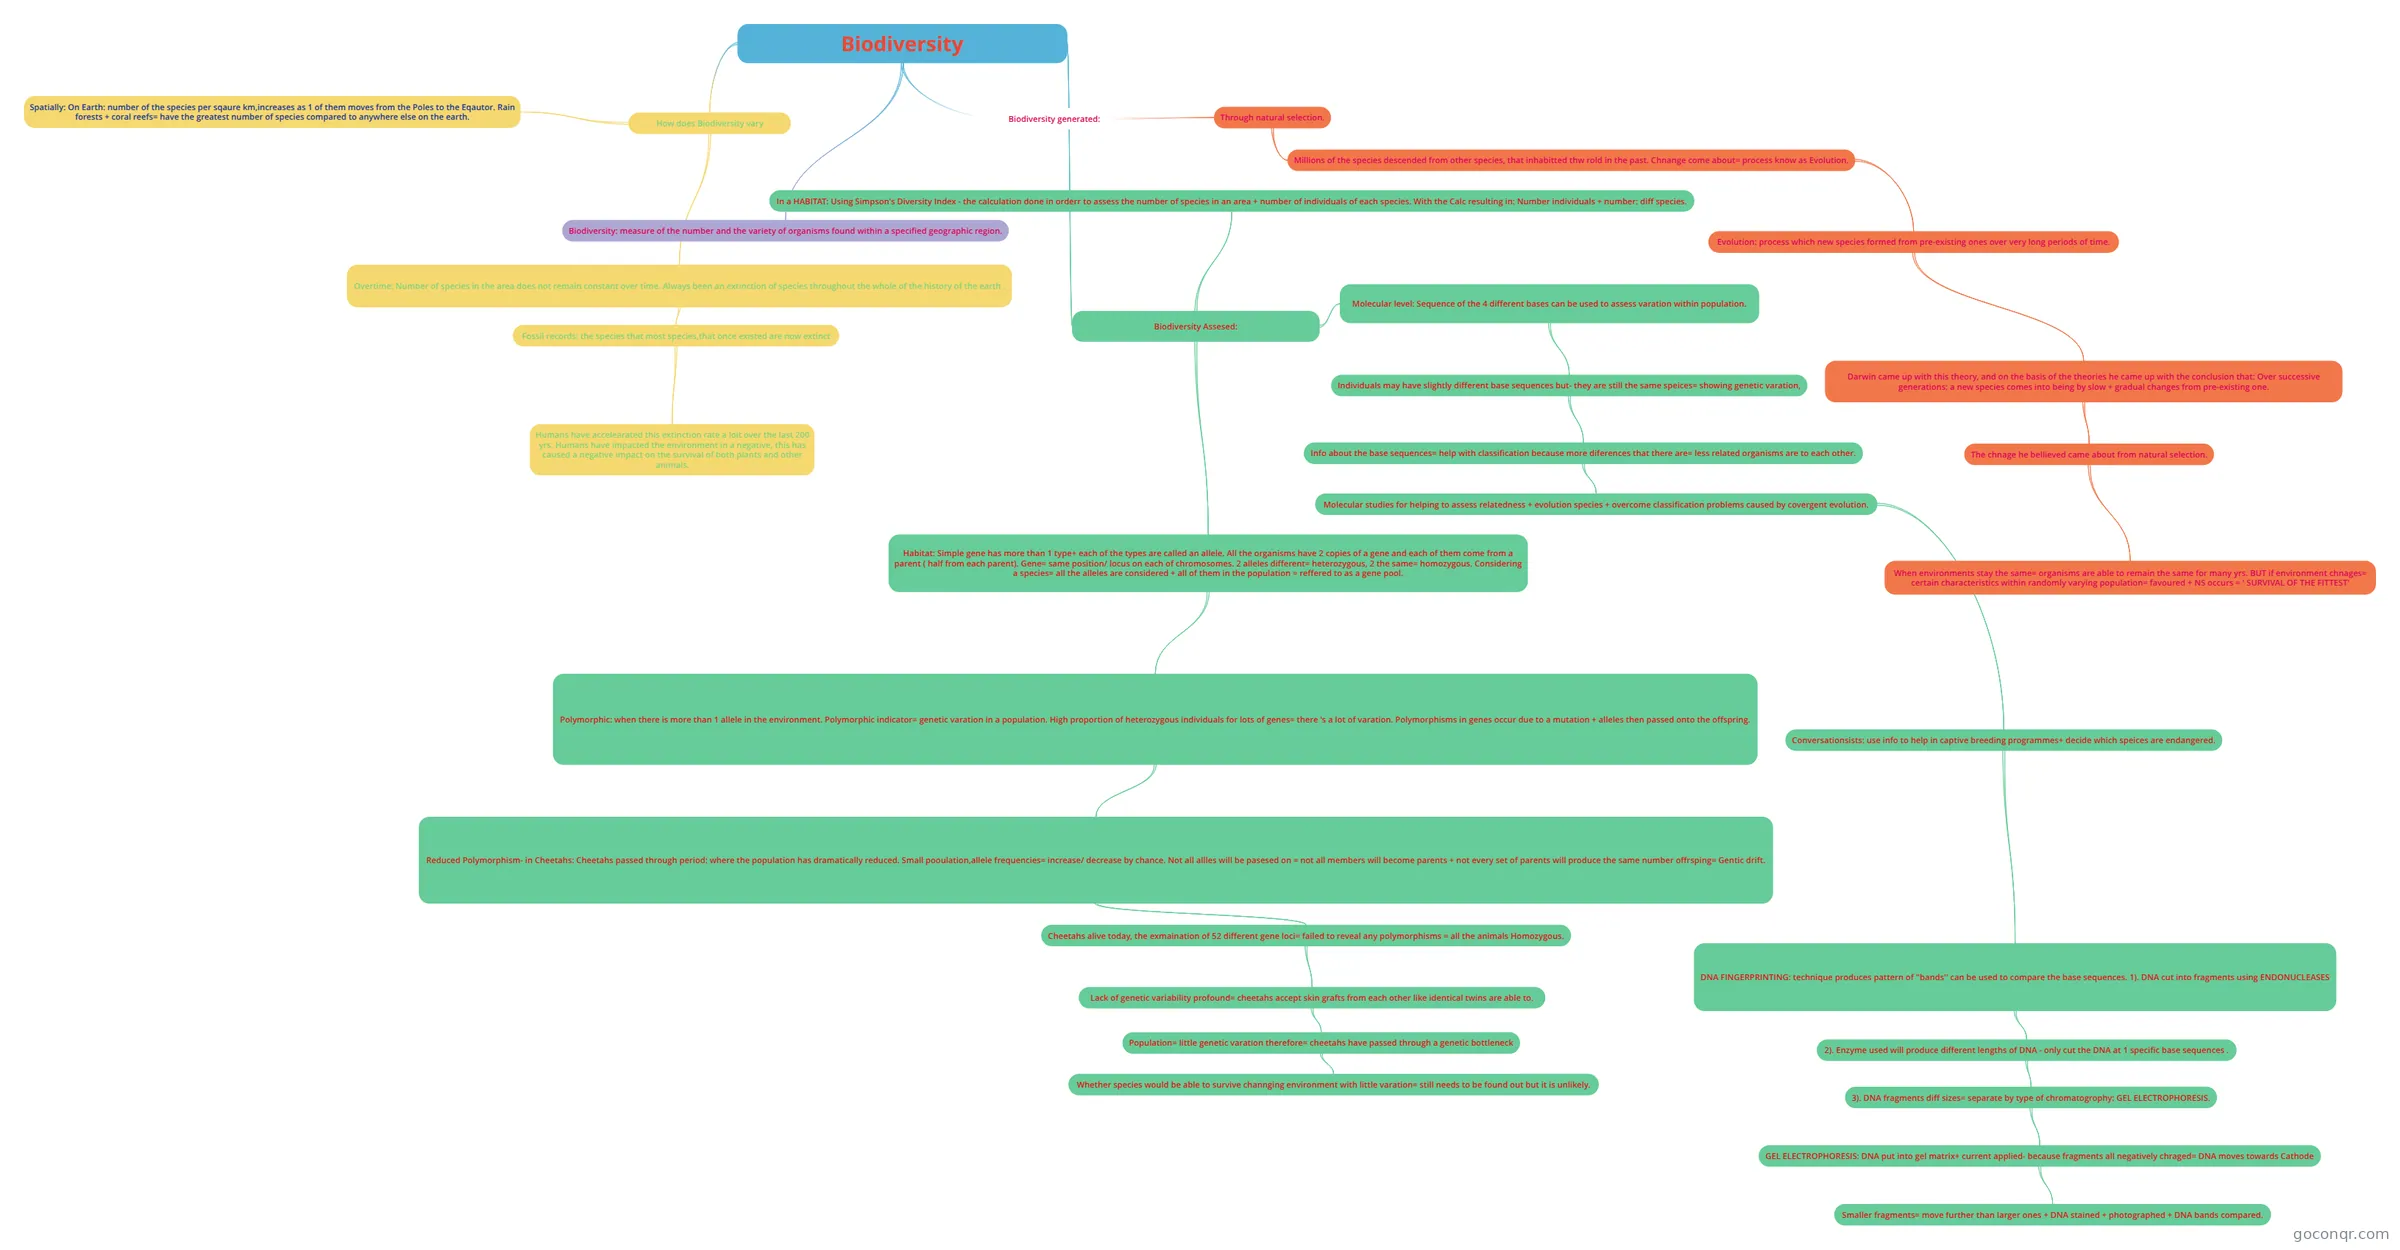
Mind map: Biodiversity
Contenido del mapa
Biodiversity
Biodiversity: measure of the number and the variety of organisms found within a specified geographic region.
Biodiversity generated:
- Through natural selection.
- Millions of the species descended from other species, that inhabitted thw rold in the past. Chnange come about= process know as Evolution.
- Evolution: process which new species formed from pre-existing ones over very long periods of time.
- Darwin came up with this theory, and on the basis of the theories he came up with the conclusion that: Over successive generations: a new species comes into being by slow + gradual changes from pre-existing one.
- The chnage he bellieved came about from natural selection.
- When environments stay the same= organisms are able to remain the same for many yrs. BUT if environment chnages= certain characteristics within randomly varying population= favoured + NS occurs = ' SURVIVAL OF THE FITTEST'
- The chnage he bellieved came about from natural selection.
- Darwin came up with this theory, and on the basis of the theories he came up with the conclusion that: Over successive generations: a new species comes into being by slow + gradual changes from pre-existing one.
- Evolution: process which new species formed from pre-existing ones over very long periods of time.
- Millions of the species descended from other species, that inhabitted thw rold in the past. Chnange come about= process know as Evolution.
- Through natural selection.
How does Biodiversity vary
- Overtime: Number of species in the area does not remain constant over time. Always been an extinction of species throughout the whole of the history of the earth .
- Fossil records: the species that most species,that once existed are now extinct
- Humans have accelearated this extinction rate a loit over the last 200 yrs. Humans have impacted the environment in a negative, this has caused a negative impact on the survival of both plants and other animals.
- Fossil records: the species that most species,that once existed are now extinct
- Spatially: On Earth: number of the species per sqaure km,increases as 1 of them moves from the Poles to the Eqautor. Rain forests + coral reefs= have the greatest number of species compared to anywhere else on the earth.
- Overtime: Number of species in the area does not remain constant over time. Always been an extinction of species throughout the whole of the history of the earth .
Biodiversity Assesed:
- Habitat: Simple gene has more than 1 type+ each of the types are called an allele. All the organisms have 2 copies of a gene and each of them come from a parent ( half from each parent). Gene= same position/ locus on each of chromosomes. 2 alleles different= heterozygous, 2 the same= homozygous. Considering a species= all the alleles are considered + all of them in the population = reffered to as a gene pool.
- Polymorphic: when there is more than 1 allele in the environment. Polymorphic indicator= genetic varation in a population. High proportion of heterozygous individuals for lots of genes= there 's a lot of varation. Polymorphisms in genes occur due to a mutation + alleles then passed onto the offspring.
- Reduced Polymorphism- in Cheetahs: Cheetahs passed through period: where the population has dramatically reduced. Small pooulation,allele frequencies= increase/ decrease by chance. Not all allles will be pasesed on = not all members will become parents + not every set of parents will produce the same number offrsping= Gentic drift.
- Cheetahs alive today, the exmaination of 52 different gene loci= failed to reveal any polymorphisms = all the animals Homozygous.
- Lack of genetic variability profound= cheetahs accept skin grafts from each other like identical twins are able to.
- Population= little genetic varation therefore= cheetahs have passed through a genetic bottleneck
- Whether species would be able to survive channging environment with little varation= still needs to be found out but it is unlikely.
- Population= little genetic varation therefore= cheetahs have passed through a genetic bottleneck
- Lack of genetic variability profound= cheetahs accept skin grafts from each other like identical twins are able to.
- Cheetahs alive today, the exmaination of 52 different gene loci= failed to reveal any polymorphisms = all the animals Homozygous.
- Reduced Polymorphism- in Cheetahs: Cheetahs passed through period: where the population has dramatically reduced. Small pooulation,allele frequencies= increase/ decrease by chance. Not all allles will be pasesed on = not all members will become parents + not every set of parents will produce the same number offrsping= Gentic drift.
- Polymorphic: when there is more than 1 allele in the environment. Polymorphic indicator= genetic varation in a population. High proportion of heterozygous individuals for lots of genes= there 's a lot of varation. Polymorphisms in genes occur due to a mutation + alleles then passed onto the offspring.
- Molecular level: Sequence of the 4 different bases can be used to assess varation within population.
- Individuals may have slightly different base sequences but- they are still the same speices= showing genetic varation,
- Info about the base sequences= help with classification because more diferences that there are= less related organisms are to each other.
- Molecular studies for helping to assess relatedness + evolution species + overcome classification problems caused by covergent evolution.
- Conversationsists: use info to help in captive breeding programmes+ decide which speices are endangered.
- DNA FINGERPRINTING: technique produces pattern of ''bands'' can be used to compare the base sequences. 1). DNA cut into fragments using ENDONUCLEASES
- 2). Enzyme used will produce different lengths of DNA - only cut the DNA at 1 specific base sequences .
- 3). DNA fragments diff sizes= separate by type of chromatogrophy: GEL ELECTROPHORESIS.
- GEL ELECTROPHORESIS: DNA put into gel matrix+ current applied- because fragments all negatively chraged= DNA moves towards Cathode
- Smaller fragments= move further than larger ones + DNA stained + photographed + DNA bands compared.
- GEL ELECTROPHORESIS: DNA put into gel matrix+ current applied- because fragments all negatively chraged= DNA moves towards Cathode
- 3). DNA fragments diff sizes= separate by type of chromatogrophy: GEL ELECTROPHORESIS.
- 2). Enzyme used will produce different lengths of DNA - only cut the DNA at 1 specific base sequences .
- DNA FINGERPRINTING: technique produces pattern of ''bands'' can be used to compare the base sequences. 1). DNA cut into fragments using ENDONUCLEASES
- Conversationsists: use info to help in captive breeding programmes+ decide which speices are endangered.
- Molecular studies for helping to assess relatedness + evolution species + overcome classification problems caused by covergent evolution.
- Info about the base sequences= help with classification because more diferences that there are= less related organisms are to each other.
- Individuals may have slightly different base sequences but- they are still the same speices= showing genetic varation,
- In a HABITAT: Using Simpson's Diversity Index - the calculation done in orderr to assess the number of species in an area + number of individuals of each species. With the Calc resulting in: Number individuals + number: diff species.
- Habitat: Simple gene has more than 1 type+ each of the types are called an allele. All the organisms have 2 copies of a gene and each of them come from a parent ( half from each parent). Gene= same position/ locus on each of chromosomes. 2 alleles different= heterozygous, 2 the same= homozygous. Considering a species= all the alleles are considered + all of them in the population = reffered to as a gene pool.
Información
- Descripción
- GCSE Biology Mapa Mental sobre Biodiversity, creado por Marlena ostrowska el 01/10/2018.
- Creado por
- Marlena ostrowska
- Visitas
- 0
- Historial
-
- Creado por Marlena ostrowska · 1 oct 2018
- Copiado por Marlena ostrowska · 1 oct 2018
- Valoración