
Apuntes
TENSILE TESTING GRAPHS - created from Mind Map
Contenido del apunte (1)
Página 1
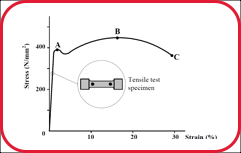
Stress Strain Graphs
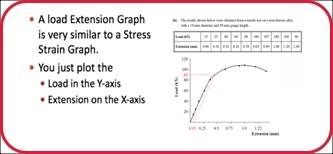
Load Extension Graphs
Key Words
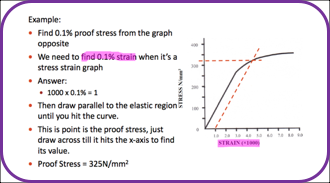
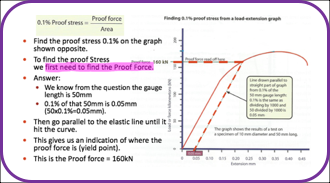
0.1% Proof Stress
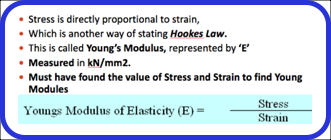
Youngs Modules of Elasticity
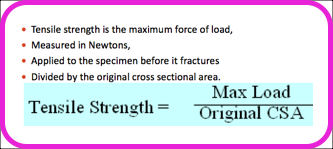
Ultimate Tensile Strength
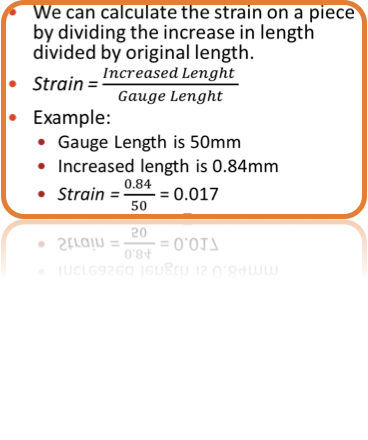
Strain
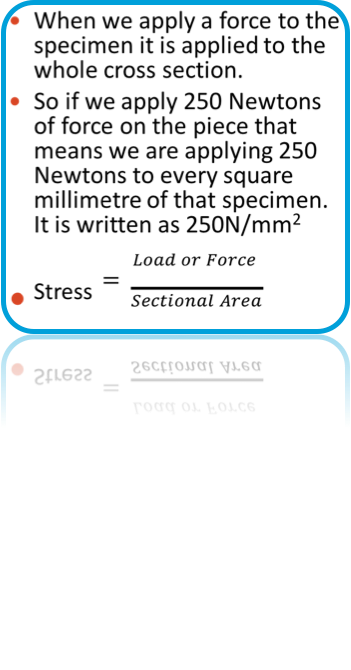
Stress
On the X-axis
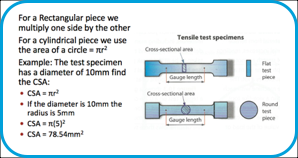
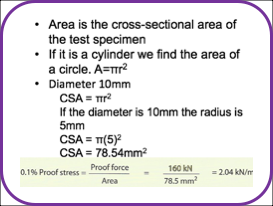
We must calculate the Sectional Area (CSA)
2 types of CSA to find
CSA of a Rectangle
CSA of a Circle
A YIELD STRENGTH or YIELD POINT is the material property defined as the stress at which a material begins to deform plastically.
DEFORMATION is when a material is in the process of deforming or distorting.
PLASTIC DEFORMATION is when a piece of properties have been changed.
PROPORTIONALLY when thing moves up at an even pace.
ULTIMATE TENSILE STRENGTH (UTS) is when a piece reaches the most tension it can take before breaking. Anymore tension and it will break.
FRACTURE to break.
Load Extension
Stress Strain
Is to find the Yield Point on the graph when it isnt clear to see
Información
- Descripción
- Sixth year Engineering Apunte sobre TENSILE TESTING GRAPHS - created from Mind Map, creado por Jack Brosnan el 02/10/2018.
- Creado por
- Jack Brosnan
- Visitas
- 1
- Historial
-
- Creado por Jack Brosnan · 2 oct 2018
- Copiado a Apunte por Jack Brosnan · 2 oct 2018
- Valoración