
Methodology (cognitive)
Diapositivas del conjunto (36)
-
- Takes place in a controlled setting
- Most scientific (reliable, valid, objective)
- IV is manipulated and other variables are kept constant and controlled so the effects can be seen on the DV which is measured
- Have experimental and control conditions, the experimental group does something and the control group does not. The control group provides a baseline measure. Results from the experimental group are compared to the baseline measure.
- To be a true experiment, ppts should be randomly assigned to the experimental or control conditions.
-
- Strengths:
- Highly controlled - know that IV causes the DV
- Easily replicated - can check for consistency and accuracy
- More scientific and objective - increases internal validity
- Weaknesses:
- Artificial environment - reduces ecological validity
- Demand characteristics - reduces internal validity
- Experimenter bias - subjective
-
- Are carried out in the field - a natural environment
- Have as many controls as possible and a manipulated IV
- The same as lab experiments but in a different type of setting
-
Evaluation of Field Experiments
- Strengths:
- Natural setting - increases ecological validity (shows behaviour/ results that would be accurate and likely to occur in real life) - easier to apply and generalise
- No demand characteristics - increases internal validity
- Weaknesses:
- Lower levels of control - uncertain that IV causes the DV - lowers internal validity
- Hard to replicate - environment changes quickly - low reliability
-
- Hypotheses: an aim states what the research hopes to investigate, whereas a hypothesis is a prediction about what will happen.
- Experimental Hypothesis: predicts something will happen. Precise and testable prediction.
- Null Hypothesis: predicts there will be no difference. The IV will have no effect on DV
- Directional Hypothesis (1 tailed): a prediction which specifies the direction of the effect.
- We only make a directional hypothesis if we have a good reason to be sure it's right ie. if previous research suggests this.
- Non-directional Hypothesis (2 tailed): a prediction which doesn't specify the direction of the effect.
-
- Independent Variable: the aspect of the research which has been manipulated, changed or controlled by the experimenter. This is presumed to have an effect on the DV.
- Dependent Variable: the aspect of research which is being measured or observed. This is presumed to be affected by changes to the IV.
-
- Independent Groups
- Repeated Measures
- Matched Pairs
-
- Every ppt experiences only one level (or condition) of the IV, allowing comparison between the results from different groups.
- Strengths:
- No demand characteristics as only doing one level so no time to guess aim
- Bigger sample
- Weaknesses:
- Individual differences
-
- Every ppt experiences every level (or condition) of the IV, allowing comparison between each ppt's scores in each condition.
- Strengths:
- Removes individual differences
- Weaknesses:
- Time consuming
- Demand characteristics
- Order effects
-
- Every ppt experiences one level of the IV, however ppts in one condition are carefully matched with ppts in the other in order to reduce individual differences.
- Strengths:
- Reduced individual differences
- No demand characteristics
- Weaknesses:
- Difficult to match people up so may still have demand characteristics
-
- Counterbalancing and Randomisation
- In a repeated measures design there are often order effects.
- Order Effects: are the possibility that experience of one level of the IV will change behaviour in another level of the IV.
- Randomisation: a coin is tossed to see which condition the ppt does first.
- Counterbalancing: (ABBA) One group of ppts does one level of the IV first and then the other. Another group of ppts does the levels of the IV in the opposite order.
-
- Operationalising Variables: this is a process of defining the measurement of a behaviour that isn't directly measurable.
- Confounding Variable: anything other than the IV which may have had an impact on the DV eg. everyday problems such as noise, temperature but can also include anything which reduces internal validity such as experimenter bias.
- Extraneous Variable: factors which we recognise as potential confounding variables. Efforts should be taken to control all confounding variables - may impact DV.
-
- Situational Variables: aspects of environment that might affect the ppt's behaviour eg. noise.
- Standardised procedures (more difficult in the field) should be used to control this.
- Ppt/ Person Variables: ways in which each ppt varies from each other, and how this could affect the results eg. mood, intelligence, nerves, concentration etc. The experimental design chosen can have an effect on ppt variables. Controlled using random allocation to conditions of the IV.
- Experimenter/ Investigator Effects: the experimenter unconciously conveys to the ppts how they should behave - called experimenter bias. May give unintentional clues to the ppts about what the experiment is about and how they expect them to behave. This affects the ppts behaviour. Also personal attributes eg. age/gender of the experimenter can affect the ppts behaviour. Controlled using double blind.
- Demand Characteristics: clues in an experiment which convey to the ppt the purpose of the research eg. surroundings, researcher's characteristics, behaviour and interpretation of the situation.
- Experimenters should minimise these factors by keeping the environment as natural as possible, carefully following standardised procedures. Different experimenters can be used.
-
- Objectivity: means that all sources of bias are minimised and that personal or subjective ideas are eliminated.
- Researchers should remain value-free, should remain unbiased - not influenced by personal opinions.
- Reliability: whether a particular method and finding can be repeated with different/same people or different occasions, to see if results are similar. If we get the same results over again under the same conditions, we can be sure of their accuracy and reliability.
- Validity: refers to the extent that we can be sure that the IV is causing the DV and the study is measuring what it set out to measure.
- Internal Validity: the extent to which we can be sure that changes in the DV are caused by changes in the IV and nothing else.
- Ecological Validity: the extent to which findings of research can be generalised to real life.
- Predictive Validity: addresses how well a specific tool predicts future behaviour eg. working memory model to predict how dyslexia/ dementia will affect someone's behaviour.
-
- This is when the null hypothesis is rejected and the alternate hypothesis is accepted when in reality the treatment has no effect ie. the outcome is different just by chance.
- Can occur when: a big loose level of significance has been chosen then, a difference is accepted when there is not really a difference.
- Consequences:
- Researcher publishes false data and other researchers waste time and resources in trying to replicate the findings.
- Scientific journals waste resources in publishing replications showing no difference.
- Original significant findings in a new research area need to be replicated, because they may be due to type I error.
-
- Type II Error: this happens when the data is consistent with the null hypothesis and it is concluded that the treatment doesn't have an effect.
- Can occur when: a small, stringent level of significance has been chosen then, no difference is accepted when there really is a difference.
- Consequences:
- Researcher may decide that his study wasn't good enough to find an effect and so he decided to improve his experiment - but may not find funding for this.
- Researcher gives up research that might have provided important findings and others don't hear about his new ideas, because scientific journals tend not to publish research findings of no significance.
-
- Type I error would find a correlation when there is none in reality.
- Type II error would find no correlation when in reality there is one.
-
- Summarise quantitive data - they act as a visual aid allowing us to see patterns in a data set.
- Must be clear and simple and have a title with each axis labelled.
- With experimental data, the IV is placed on the horizontal x axis and the DV is placed on the vertical y axis.
- Bar charts, Histograms, Scattergraph
-
- Used to represent 'discrete data' where the data is in categories - placed on the x axis. The mean or frequency is one the y axis.
- Columns don't touch and have equal width and spacing.
-
- Used to represent data on a continuous scale, columns touch because each one forms a single score (interval) on a related scale.
- Scores (intervals) are placed on the x axis.
- The height of the column shows the frequency of values - this goes on the y axis.
-
- Used for measuring the relationship between 2 variables.
- Data from one variable is presented on the x axis, while the other is presented on the y axis.
- We plot an X on the graph where the 2 variables meet.
- The pattern of plotted points reveals different types of correlation.
-
- Nominal Data: a level of data where scores of ppts have been grouped into categories.
- Ordinal Data: data where it's possible to rank scores in order.
- Interval Data: Data where each unit represents an equal interval ie. represents exactly the same quantity of the thing being measured eg. Celsius
- Ratio Data: Like interval data, this also measures a characteristic in equal intervals but has a natural zero point ie. not possible to have a negative score eg. time
-
- Inferential Statistics: methods used to test the significance of research findings (how does the observed value compare with the critical value?). Significance is a statistical concept usually stated as P≤0.05. 'a less than 5% probability that differences occurred by chance' always want to be 95% sure that the IV causes the DV.
- Descriptive Statistics: methods used to summarise the findings of research such as measures of central tendency, measures of dispersal and graphs.
- Critical Value: the statistical value equating to a probability of 0.05 that differences between levels of the IV occurred by chance. The minimum statistical value required for a difference between scores in levels of an IV (or the strength of a relationship between co-variables) to be considered significant.
- Observed Value: A statistical representation of the actual difference found between levels of the IV (or the strength of a relationship between co-variables) to be considered significant. The result of a statistical test.
-
Using Observed and Critical Values
- If there is a letter R in the name of the test (Chi-square, Spearman's) - the observed value should be gReateR than the critical value for the results to be significant.
- If there's no R in the name of the test (Mann-whitney, Wilcoxon) - the observed value should be less than the critical value for the results to be significant.
-
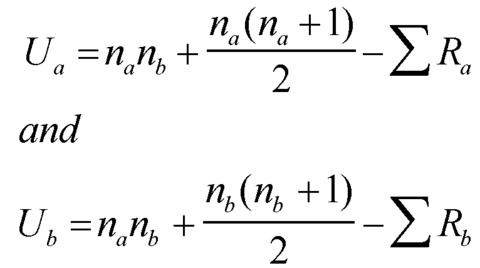
- Experimental Design = Independent Groups
- Level of Data = Ordinal/ Interval
- All the scores ranked as if they are from a single group
- Add up the ranks assigned to the smallest group
- Substitute into formula
- Select the smaller of Ua and Ub and call it U (observed value)
- Check the value of U against the critical values
- OV should be less than the CV to be significant
- Ra=total of the ranks in the smallest group
- Rb=total of the ranks in the largest group
- Na=number of ppts in the smallest group
- Nb=number of ppts in the largest group
-
- Experimental Design = Repeated measures or matched pairs
- Level of Data = Ordinal or Interval
- Work out the difference between the 2 scores of each ppt (always subtracting in the same direction) and keep the + and - signs
- Rank the difference, Ignore the +/- signs. Also ignore any 0 scores - these results are omitted.
- Re-add the +/- signs
- Add up all the numbers with a + sign and add up all the numbers with a - sign. The smaller of the 2 figures is known as T.
- Look up the T score to establish significance
- N is the number of scores/ ppts left
- The observed value should be less than the critical value to be significant
-
- very detailed study of an individual or small group
- Pools data and looks for common themes and threads
- Triangulation - using many methods to collect data such as a combination of questionnaires, observations, case histories, interviews, experiments
-
- Strengths:
- Can be used to gather data that can't be obtained by any other means - where it's not possible to manipulate the IV eg. brain injuries or PTSD
- High ecological validity - in a natural real life situation
- Mundane Realism - realistic tasks
- Triangulation - can obtain qualitative and quantitative data through multiple methods of collecting data
- Weaknesses:
- Not replicable because each case study is unique - therefore can't easily be tested for reliability
- Generalisation problems - can't apply to all situations
- Accuracy - people may lie (memory)
- Bias - close relationship between researcher and ppts - may start to view abnormal behaviour as normal
- Cause and effect statements difficult
- Time consuming and expensive
-
- Quantitative Data: numerical data - can be measured easily
- Qualitative Data: non-numerical data such as transcripts of interviews or detailed diary extracts eg. diaries, books, open questions, audio tapes of people talking, videos of people's behaviour (in-depth and detailed)
-
Qualitative Data - Reliability
- Reliability: the consistency of the research findings and how consistently it's measured
- Qualitative data is less controlled so hard to replicate
- (eg. HM has individual differences/ unique case so it can't be replicated. Only 1 person observing so a lack of inter-rater reliability)
-
- Validity: does it measure what it's supposed to measure
- Qualitative data may include experimenter/ researcher bias, demand characteristics and social desirability that reduce internal validity. Generally high ecological validity tho
-
Qualitative Data - Subjectivity
- Subjectivity: opinion-based. Aims to view the topic from the perspective of those who experience it. The process of analysis also depends on the researcher's perceptions.
- Qualitative data has opinions to it however data aims to be objective
- (researcher's perceptions of HM may be biased)
-
Qualitative Data - Objectivity
- Objectivity: research is value-free and not contaminated by personal opinions which makes it scientific
- Qualitative data is usually subjective, not objective
-
Qualitative Data - Generalisability
- Generalisability: generalising from results of research to wider population.
- Case Studies can only relate to 1 individual (or a small group) therefore results often aren't representative of the wider population
-
- Had brain surgery in 1953 when he was 27 years old - Hippocampus removed to alleviate severe symptoms of epilepsy
- Although surgery controlled the severe symptoms of epilepsy (seizures), he suffered memory impairment as a side effect
- His STM was normal but he was unable to transfer any new information into his LTM
- He showed no knowledge of current affairs because he forgot any new items as soon as he read about them; he knew nothing of recent family events including moving house and the death of his father
- He could remember people he'd known long ago
- He was unable to store information on new people he encountered and they remained forever complete strangers to him
- He was able to learn and remember perceptual and motor skills although he needed reminding of what he was able to do
-
- Strengths:
- in depth and detailed
- High ecological validity
- Triangulation
- Weaknesses:
- Replicability is low
- Time consuming
- Unethical
- Researcher bias as happened over a long time
- May be unique/ individual differences
Información
- Descripción
- Includes: lab and field experiments, Variables, Hypotheses, Experimental Design, Inferential statistics, Mann Whitney U, Wilcoxon and Case studies
- Creado por
- Ella Middlemiss
- Visitas
- 6
- Valoración