
Flashcards
Linear Regression Inference Test
Cards in this deck (20)
- 1A random sample of 15 college soccer players were selected to investigate the relationship between heart rate, beats per min (bpm), and maximal oxygen uptake, L/min. The heart rate and maximal oxygen uptake were recorded for each player during a training session. A regression analysis of the data was conducted, where heart rate is the explanatory variable and maximal oxygen uptake is the response variable. If a 95 percent confidence interval to estimate the slope of the population regression line is calculated to be (0.184, 0.789). Assume all conditions for inference were met. Based on the calculated confidence interval, which of the following claims is supported by the confidence interval?There is a positive linear relationship between actual heart rate and predicted maximal oxygen uptake.
- 2A high school basketball coach wants to see whether there is a linear relationship between player height and the number of points scored in a game by basketball players in the coach’s state. A random sample of 25 basketball players in the coach’s state was selected. A regression analysis of the data was conducted, where height is the explanatory variable and points scored in a game is the response variable. If a 96 percent confidence interval is constructed for the slope of the population regression line, which of the following is a condition that must be checked?The true relationship between height and points scored in a game is linear.
- 3An agronomist is an expert in soil management and crop production. A certain state hires an agronomist to investigate whether there is a linear relationship between a wheat stalk’s height and the yield of wheat. The agronomist collected data and used the data to test the claim that there is a linear relationship at a significance level of alpha = 0.05. He ran a hypothesis test on slope that yielded a p-value of 0.025. Which of the following is a correct conclusion about the claim?The null hypothesis is rejected because 0.025 < 0.05. There is sufficient evidence to suggest that there is a linear relationship between a wheat stalk’s height and its yield.
- 4A restaurant manager collected data on the number of customers in a party in the restaurant and the time elapsed until the party left the restaurant. The manager computed a correlation of 0.78 between the two variables. What information does the correlation provide about the relationship between the number of customers in a party at the restaurant and the time elapsed until the party left the restaurant?The parties with a larger number of customers are associated with the longer times elapsed until the party left the restaurant.
A positive correlation indicates that as values of one variable increase, the values of the other variable tend to increase. - 5To investigate the relationship between the selling price of a house, y, in dollars, and the size of the house x, in square feet, a local builder collected data on a random sample of 120 houses from a certain region. Assume that the conditions for inference for the slope of a regression line are met. The resulting 94 percent confidence interval for the population slope of the regression line relating price and size is given by (64, 99). Assuming that the conditions for inference for the slope of the regression equation are met. Which of the following is the correct interpretation of the interval?We are 94 percent confident that an increase of one square foot in the size of a house in the sample, the average increase in selling price is between $64 and $99.
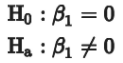
- 6A car retailer wanted to see if there is a linear relationship between overall mileage and the suggested retail price of a car. The retailer collected data on 18 cars of a similar type selected at random and used the data to test the claim that there is a linear relationship. The following hypotheses were used to test the claim. The test yielded a test statistic of 2.486. What is the appropriate p-value?0.024
- 7A jeweler was interested in the relationship between the weight of a diamond, in carats, and the market price of the diamond, in dollars. The jeweler selected a random sample of diamonds with the same cut and quality and recorded the weight and market price of each diamond. Which of the plots provides the strongest evidence that its regression line is an appropriate model for the data and is consistent with the assumptions required for inference for regression?
- 8Student A calculated a 92 percent confidence interval (3.5, 9.6) to estimate the slope of a regression model for a set of bivariate data with 27 data values. Student B believes that the width of the confidence interval will increase if a sample size of 37 is used with all other values remaining unchanged. Student A believes that the width of the confidence interval will increase if the confidence level is increased to 95 percent with all other values remaining unchanged. Which statement is true about the students’ claims?Only Student A is correct.
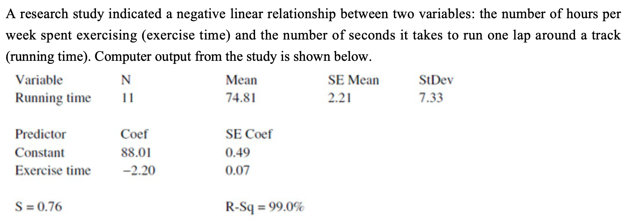
- 9Which of the following statements is a correct interpretation of the value -2.20 in the output?On average there is a predicted decrease of 2.20 seconds in running time for every one hour increase in exercise time.
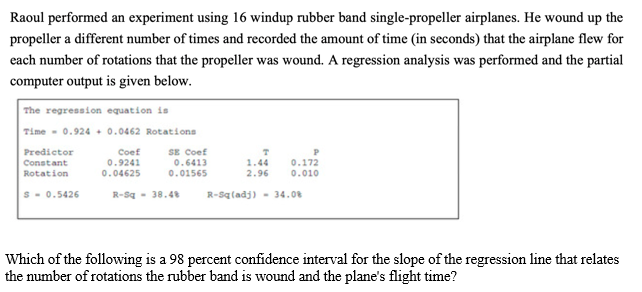
- 10—0.0462 ± (2.624)(0.01565)
- 11An exponential relationship exists between the explanatory variable and the response variable in a set of data. The common logarithm of each value of the response variable is taken, and the least-squares regression line has an equation of log(yˆ)=7.3−1.5x. Which of the following is closest to the predicted value of the response variable for x=4.8 ?1.26
Substituting x=4.8 into the equation gives log(yˆ)=7.3−1.5(4.8) or log(yˆ)=0.1. To solve for yˆ, raise 10 to the power of 0.1 to get 1.26. - 12A car magazine claims that there is a linear relationship between a car’s weight, in pounds, and the car’s fuel efficiency, in miles per gallon. The magazine collected data and used the data to test the claim at a significance level of α=0.05. The magazine tested the following hypotheses. H0:β1=0 Ha:β1≠0 The test yielded a t-value of 1.95 and a p-value of 0.08. Which of the following is a correct conclusion about the magazine’s claim?The null hypothesis is not rejected because 0.08>0.05 . There is not sufficient evidence to suggest that there is a linear relationship between a car’s weight and its fuel efficiency.
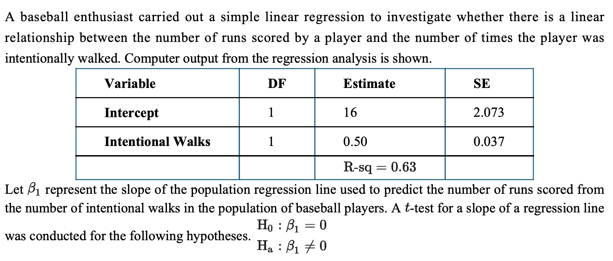
- 13Using the information from the table, calculate the p-value for the appropriate test.0.0470
- 14When computing a confidence interval for the slope of a regression line, a plot of the residuals versus the fitted values can be used to check which of the following conditions?The standard deviation of y does not vary as x varies.
- 15A student recorded the number of hours his classmates claimed to have studied and the test scores that were earned for a series of recent exams. The resulting data were used to calculate a hypothesis test to determine whether there is a linear relationship between the number of hours spent studying and the test score earned. What are the appropriate hypotheses for the test?Ho : β =0; Ha : β ≠0
- 16A Least Squares Regression Line was calculated as: y-hat = 30 + 4x. What is the residual, and corresponding relationship with the LSRL, for an observed point of (25, 150)?20, the LSRL underpredicted the observed value.
- 17A zoologist selected 12 black bears in a Canadian habitat at random to examine the relationship between the age in years, x, and the weight in tens of pounds, y. The 95 percent confidence interval for estimating the population slope of the linear regression line predicting weight in tens of pounds based on the age in years is (7.0, 18.4). Assume that the conditions for inference for the slope of the regression equation are met. Which of the following is the correct interpretation of the confidence level?If a researcher was to repeatedly take samples of size 12 and construct 95 percent confidence intervals, in the long run, approximately 95 percent of the calculated intervals would succeed in capturing the population slope of the linear regression model predicting weight based on age.
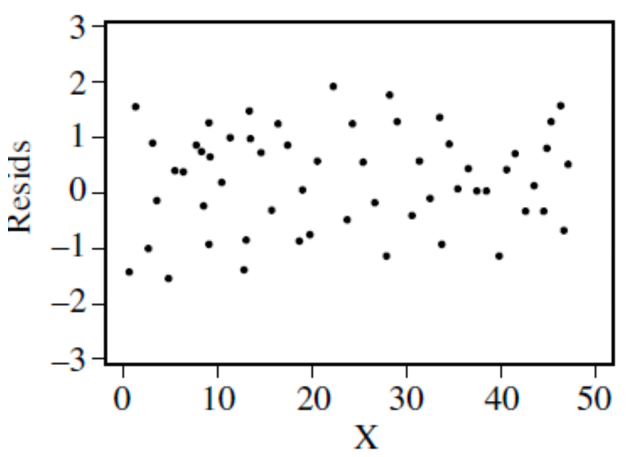
- 18Eliza plans on constructing a confidence interval for the slope of a regression line. She creates the residual plot shown to check the conditions for creating the interval. Which of the following conditions appear to be met based on the residual plot? I. The true relationship between x and y is linear. II. The standard deviation of y is constant for different levels of x. III. The value of 0 is contained in the confidence interval.I and II only
Statement I is correct, since there is no evident pattern in the residuals. Statement II is correct, since as x increases, the spread of the residuals neither increases nor decreases.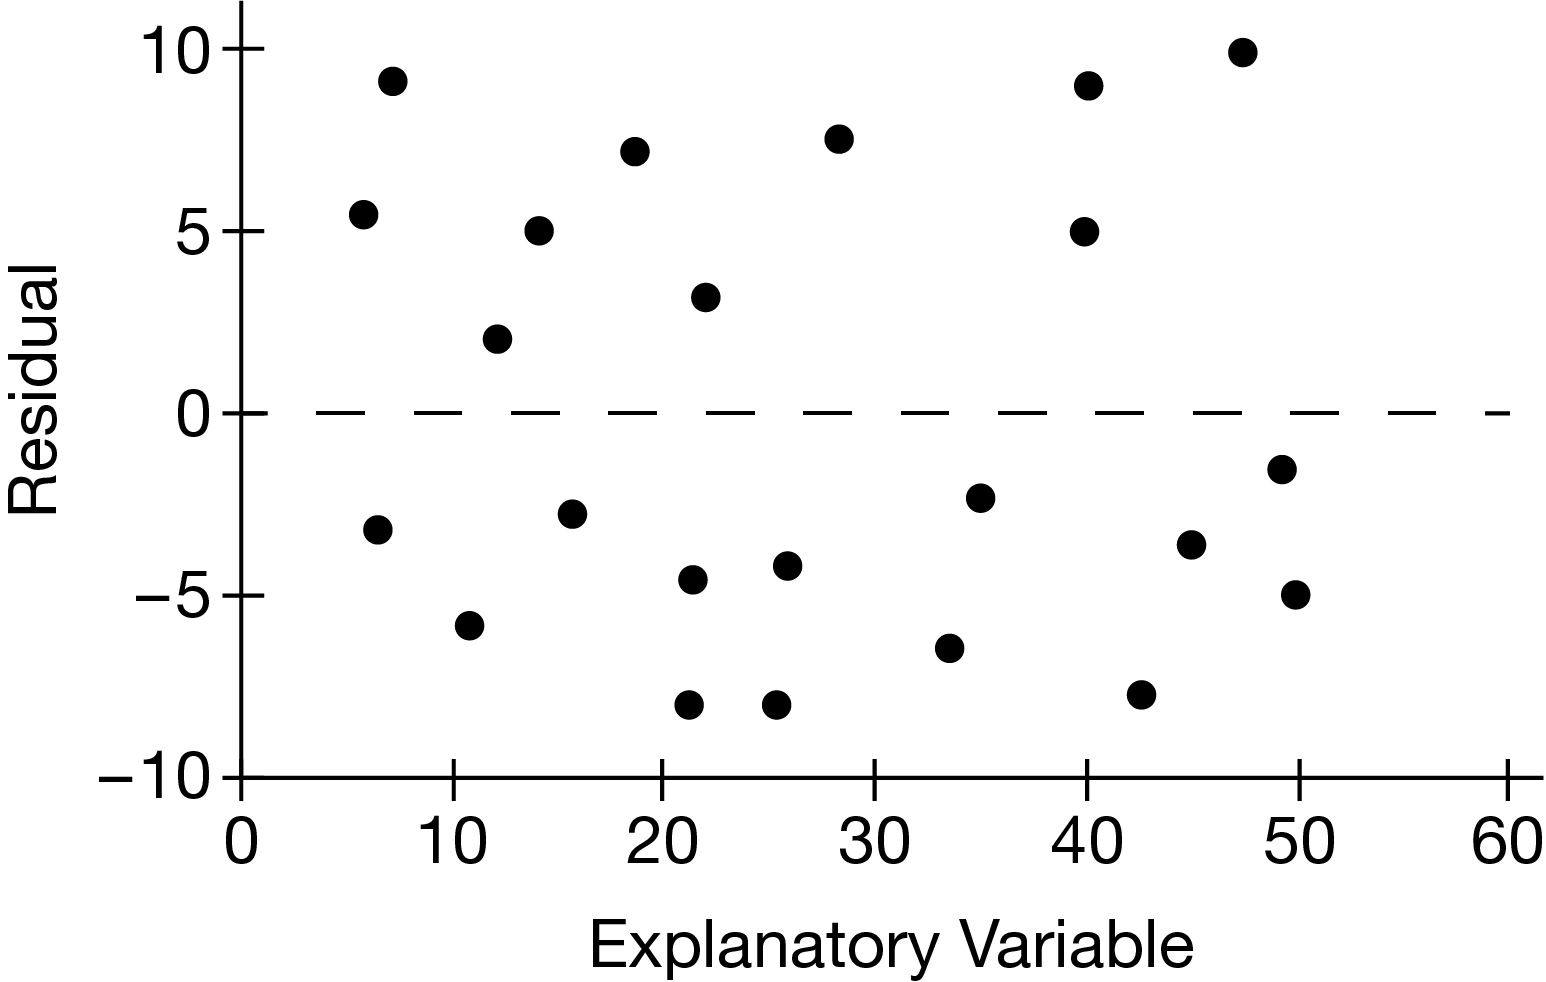
- 19A scientist gathered data on the blood oxygen level, L, and the age, A, of 52 randomly selected people. Using the data, the scientist calculated the least-squares regression line to be: Predicted blood oxygen level=163+2.4(age). The standard error of the slope = 0.83. If the conditions for inference are met, which of the following is closest to the value of the test statistic to test the hypotheses Ho:β=0 versus Ha:β≠0?t = 2.89
- 20A medical researcher is analyzing whether percent concentration for a new pain reliever's active ingredient can be used to predict the time it takes for relief to set in. The researcher selected a random sample of 12 patients (all of similar age, body composition, etc) and recorded the time until relief for each patient, in minutes, and the percent concentration of the active ingredient each patient was given. The researcher wants to estimate the mean change in the time, in minutes, for each increase of 1 percent concentration of the active ingredient. Assuming the conditions for inference have been met, which of the following inference procedures is most appropriate for this investigation?A linear regression t-interval for slope
Information
- Description
- 10th grade Math Flashcards on Linear Regression Inference Test, created by Kelly Chen on 02/05/2021.
- Created by
- Kelly Chen
- Views
- 1
- Rating