
Mind map
10.6 Representing variation graphically
Map content
10.6 Representing variation graphically
Continuous and discontinuous variation
- Continuous
- Quantitative, no discrete categories
- A range of intermediate stages between 2 extreme phenotypes
- Leaf size, worm length
- Often polygenic
- Affected by many genes
- Usually affected by the environment but not usually
- Discontinuous
- Usually controlled by 1 or 2 genes
- Variation within distinct categories
- Not usually affected by environment
- Continuous
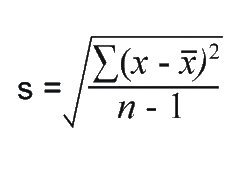
Standard deviation
- S = measure of spread, therefore the greater the SD the greater the spread
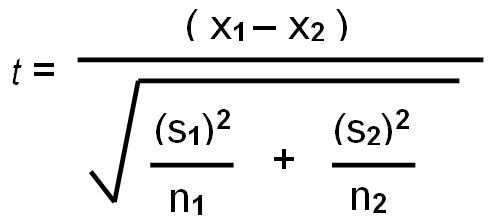
Student T-Test
- Remember to state H0 at start of workings
- How to calculate degrees of freedom
- df = (n1 +n2)-2
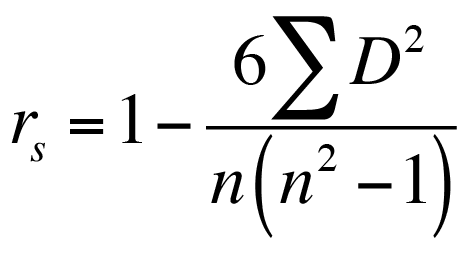
Spearman's rank
- Rs = correlation coefficient
- d = difference in ranks
- E = sum of
- n = number of pairs of data
Images and files in the map
Information
- Description
- Biology Mind Map on 10.6 Representing variation graphically, created by Joe Hitchings on 31/05/2020.
- Created by
- Joe Hitchings · May 2020
- Updated
- May 31, 2020
- Views
- 8
- Rating