
Mind map
Demography
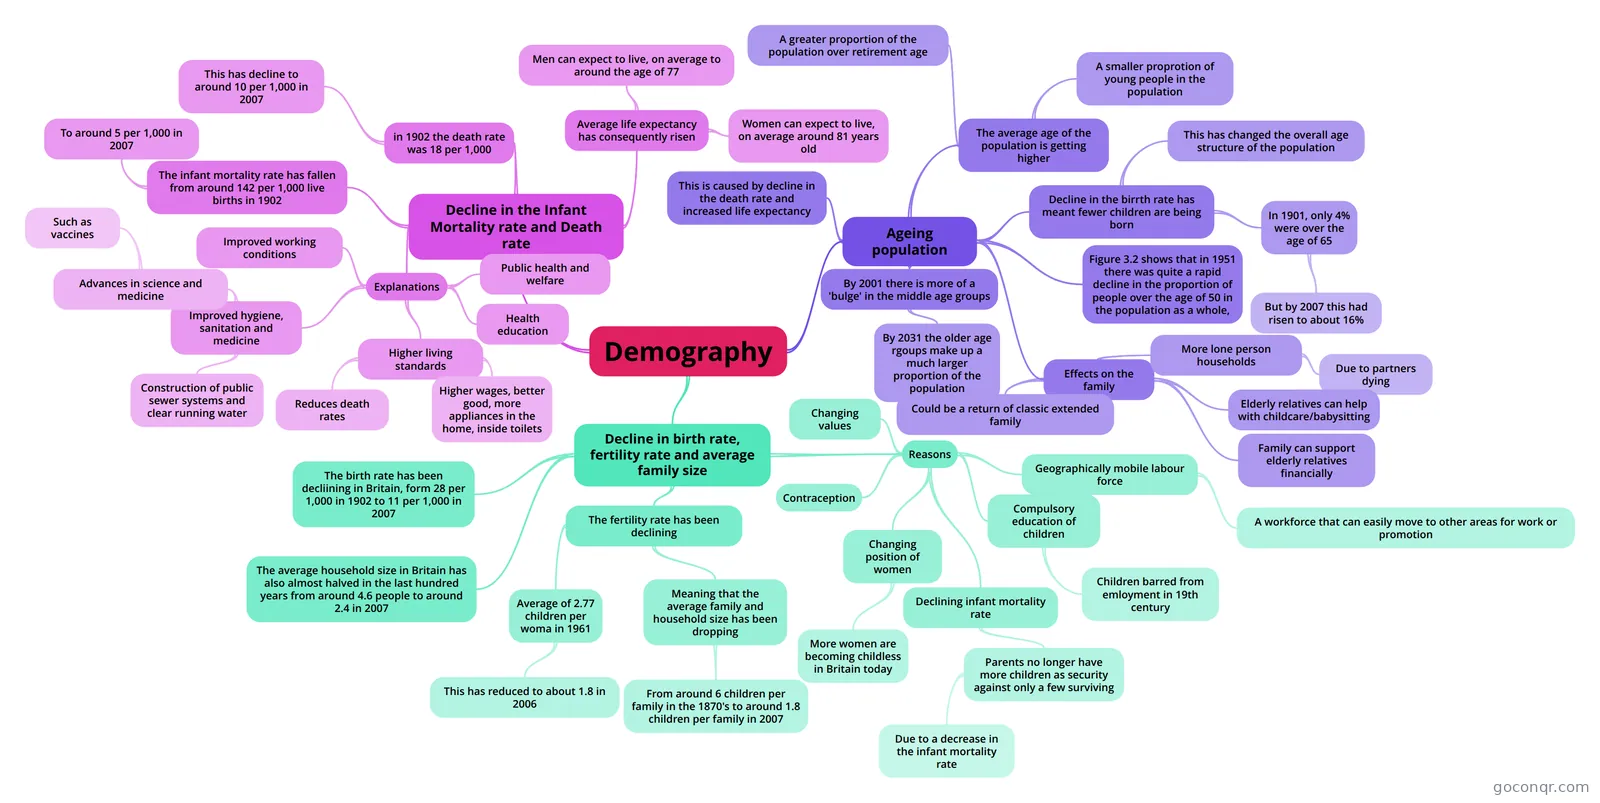
Mind map: Demography
Map content
Demography
Decline in the Infant Mortality rate and Death rate
- Explanations
- Improved hygiene, sanitation and medicine
- Construction of public sewer systems and clear running water
- Advances in science and medicine
- Such as vaccines
- Higher living standards
- Reduces death rates
- Higher wages, better good, more appliances in the home, inside toilets
- Public health and welfare
- Health education
- Improved working conditions
- Improved hygiene, sanitation and medicine
- in 1902 the death rate was 18 per 1,000
- This has decline to around 10 per 1,000 in 2007
- The infant mortality rate has fallen from around 142 per 1,000 live births in 1902
- To around 5 per 1,000 in 2007
- Average life expectancy has consequently risen
- Men can expect to live, on average to around the age of 77
- Women can expect to live, on average around 81 years old
- Explanations
Ageing population
- This is caused by decline in the death rate and increased life expectancy
- The average age of the population is getting higher
- A greater proportion of the population over retirement age
- A smaller proprotion of young people in the population
- Decline in the birrth rate has meant fewer children are being born
- This has changed the overall age structure of the population
- In 1901, only 4% were over the age of 65
- But by 2007 this had risen to about 16%
- Figure 3.2 shows that in 1951 there was quite a rapid decline in the proportion of people over the age of 50 in the population as a whole,
- By 2001 there is more of a 'bulge' in the middle age groups
- By 2031 the older age rgoups make up a much larger proportion of the population
- Effects on the family
- More lone person households
- Due to partners dying
- Elderly relatives can help with childcare/babysitting
- Family can support elderly relatives financially
- Could be a return of classic extended family
- More lone person households
Decline in birth rate, fertility rate and average family size
- Reasons
- Contraception
- Compulsory education of children
- Children barred from emloyment in 19th century
- Changing position of women
- More women are becoming childless in Britain today
- Declining infant mortality rate
- Parents no longer have more children as security against only a few surviving
- Due to a decrease in the infant mortality rate
- Parents no longer have more children as security against only a few surviving
- Geographically mobile labour force
- A workforce that can easily move to other areas for work or promotion
- Changing values
- The birth rate has been decliining in Britain, form 28 per 1,000 in 1902 to 11 per 1,000 in 2007
- The fertility rate has been declining
- Average of 2.77 children per woma in 1961
- This has reduced to about 1.8 in 2006
- Meaning that the average family and household size has been dropping
- From around 6 children per family in the 1870's to around 1.8 children per family in 2007
- Average of 2.77 children per woma in 1961
- The average household size in Britain has also almost halved in the last hundred years from around 4.6 people to around 2.4 in 2007
- Reasons
Information
- Description
- Sociology (Demography) Mind Map on Demography, created by dousl002 on 16/04/2013.
- Created by
- dousl002
- Views
- 176
- Tags
- Rating