Mind map
Research
Map content
Research
YouTube
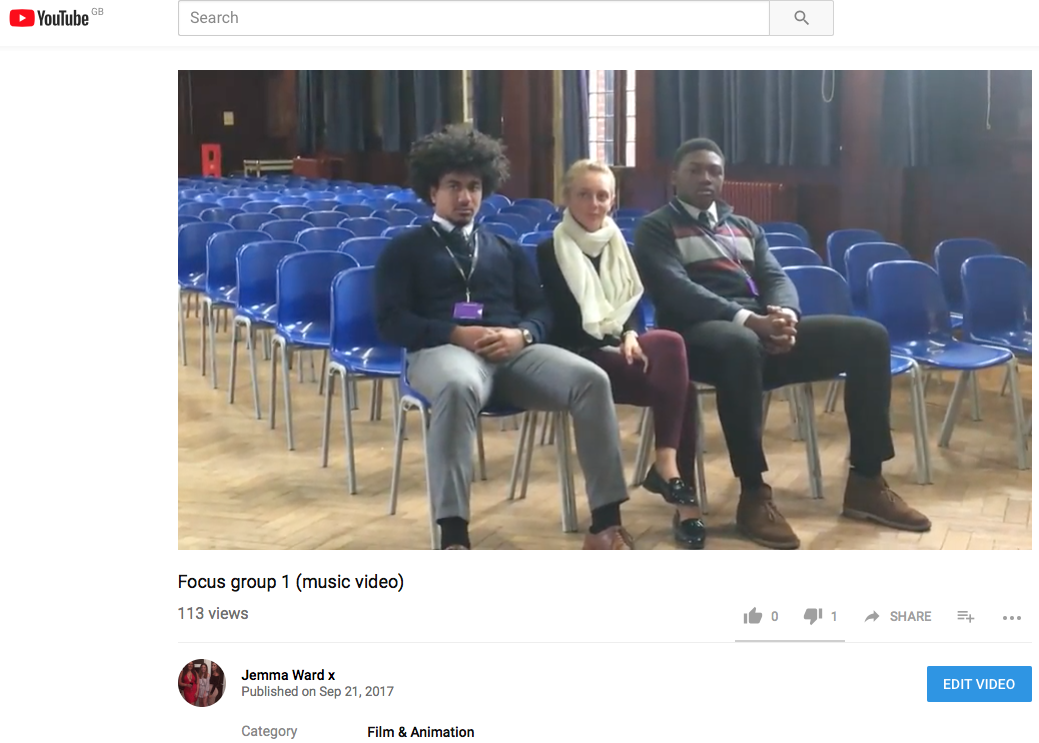
- I used YouTube when presenting my research, this was by uploading production diaries. I also used it watch videos on camera angles and techniques, this helped when it came to filming as we knew to film lots of different angles and then we could pick and choose what footage we liked and didn't like as much.
- When comparing'Textual Analysis' I used YouTube to watch the video and screenshot different shots in which I was writing about, this was to help the reader understand what I was explaining.
- I also used YouTube to gain knowledge and understanding on the specific genre in which our music video is, this helped me get a better idea of the codes and conventions of the Indie genre.
- I embeded some YouTube videos into my 'reseach' blog posts which made it more interactive for the viewer.
Blogger
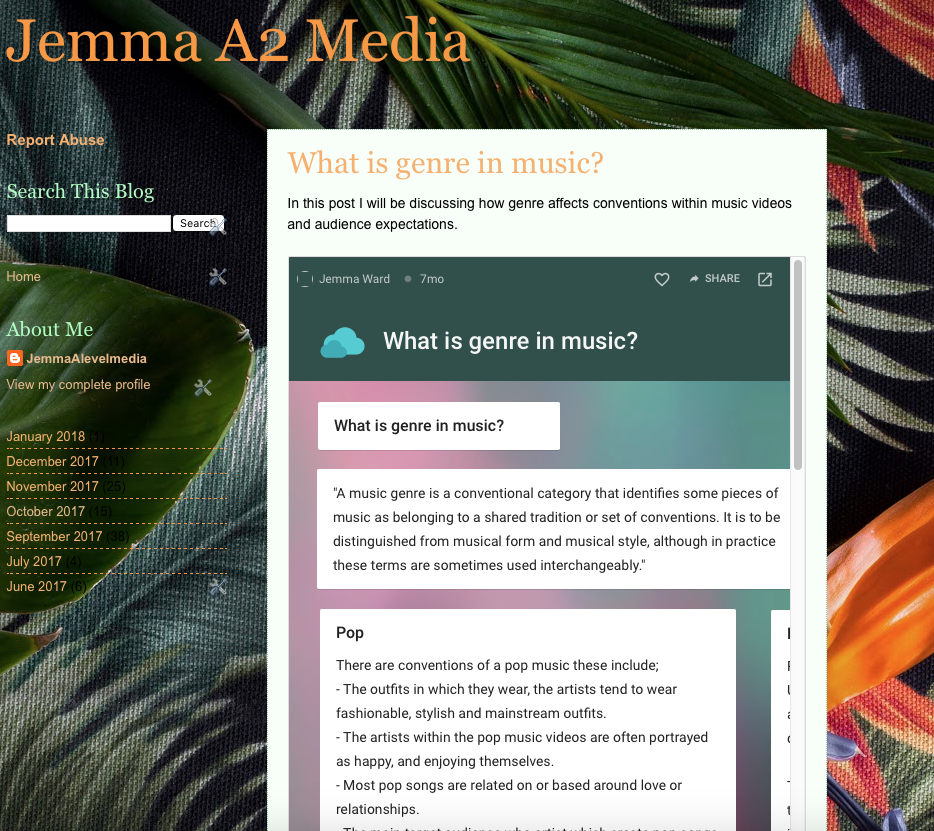
- Blogger was the key component of my A2 coursework, I used it to display my research and findings, it helped me organise my research and show it in chronological order which shows the development all the way through to the finished product, tracking my progress.
Web 2.0 tools
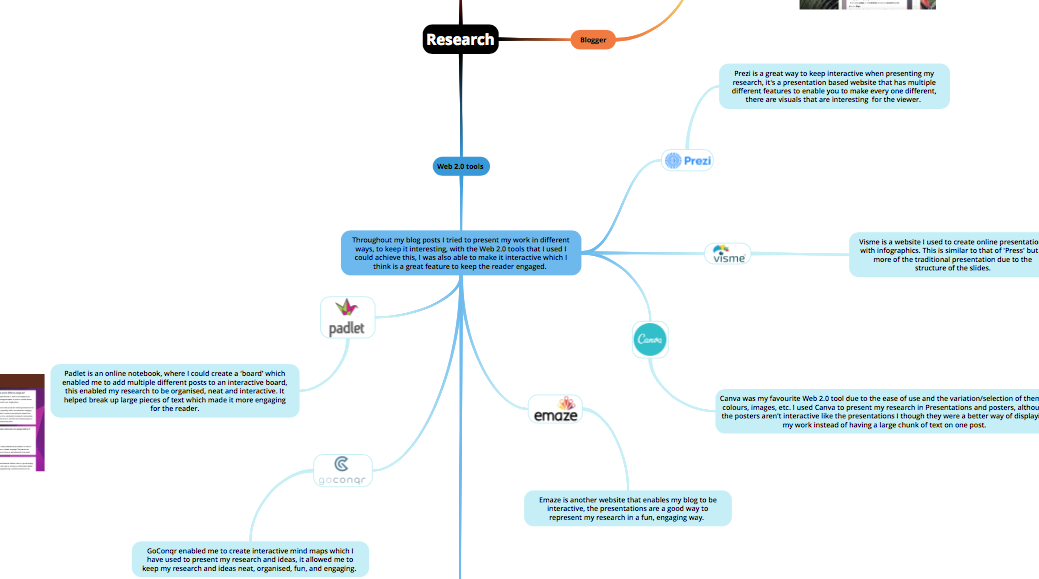
- Throughout my blog posts I tried to present my work in different ways, to keep it interesting, with the Web 2.0 tools that I used I could achieve this, I was also able to make it interactive which I think is a great feature to keep the reader engaged.
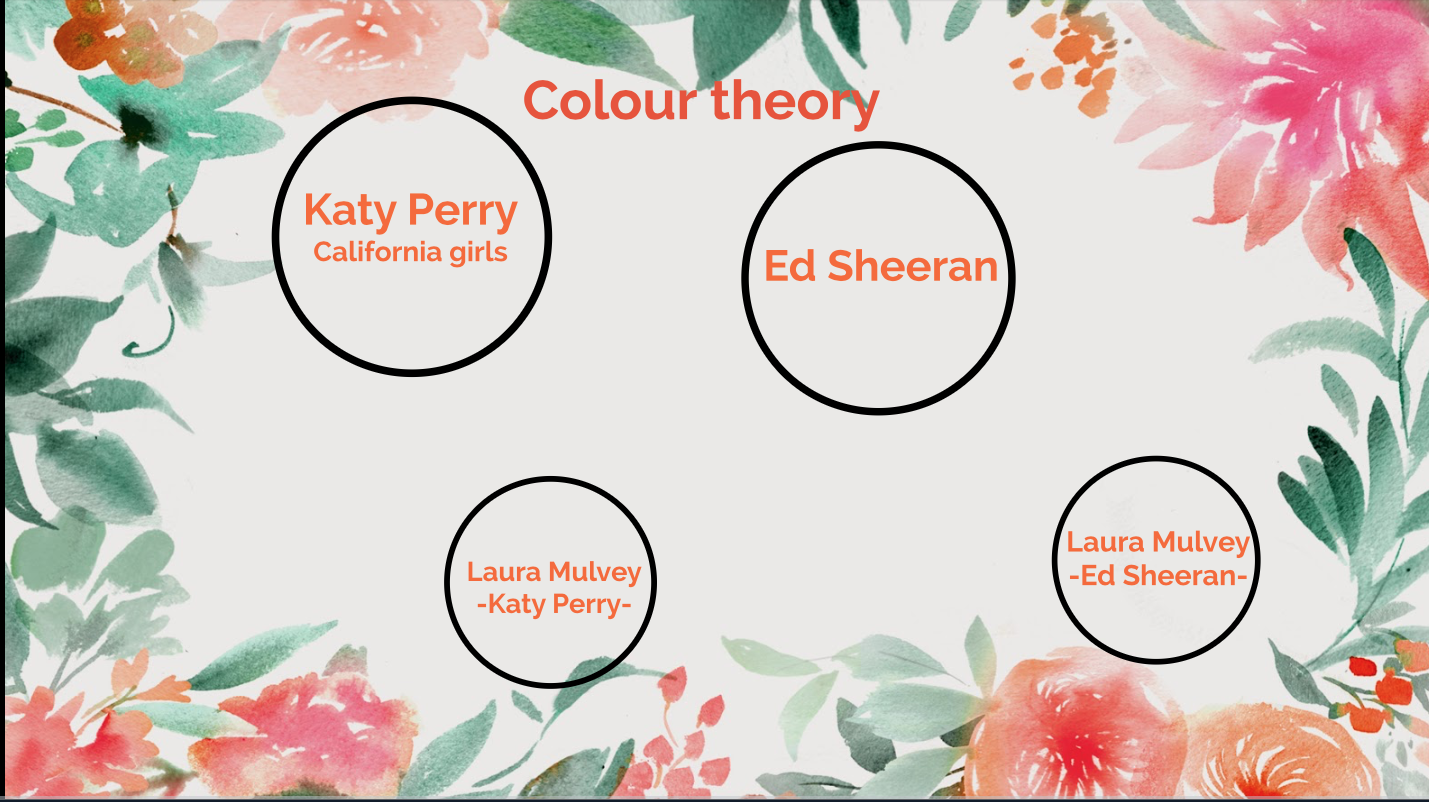
- Prezi is a great way to keep interactive when presenting my research, it's a presentation based website that has multiple different features to enable you to make every one different, there are visuals that are interesting for the viewer.
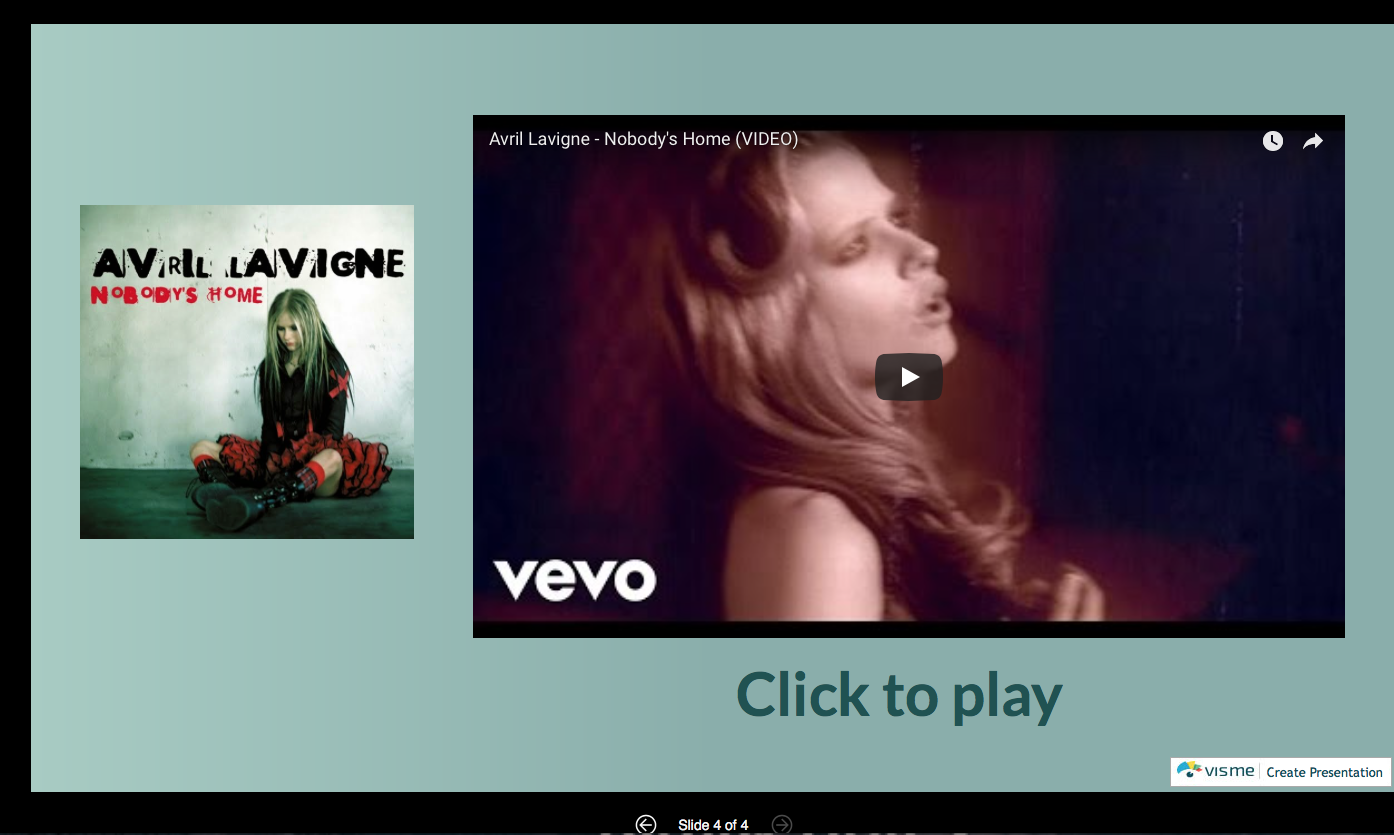
- Visme is a website I used to create online presentations with infographics. This is similar to that of 'Press' but is more of the traditional presentation due to the structure of the slides.
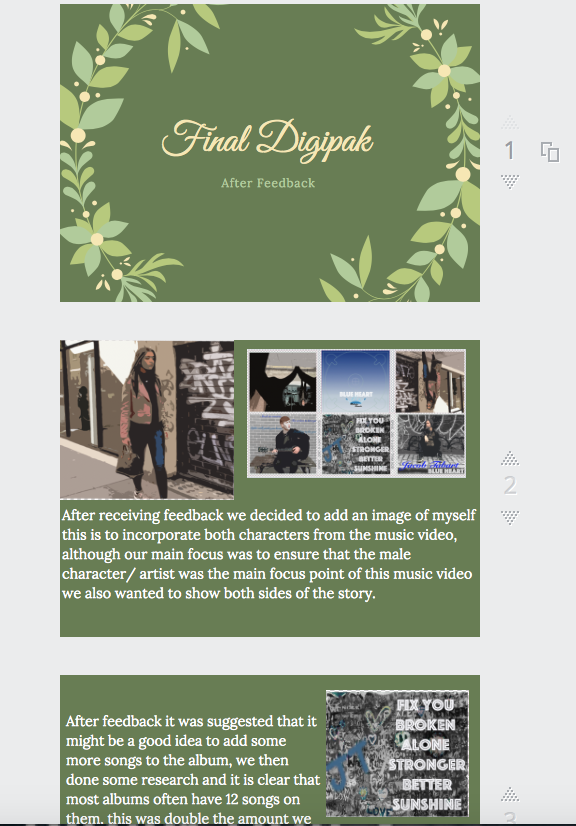
- Canva was my favourite Web 2.0 tool due to the ease of use and the variation/selection of themes, colours, images, etc. I used Canva to present my research in Presentations and posters, although the posters aren't interactive like the presentations I though they were a better way of displaying my work instead of having a large chunk of text on one post.
- GoConqr enabled me to create interactive mind maps which I have used to present my research and ideas, it allowed me to keep my research and ideas neat, organised, fun, and engaging.
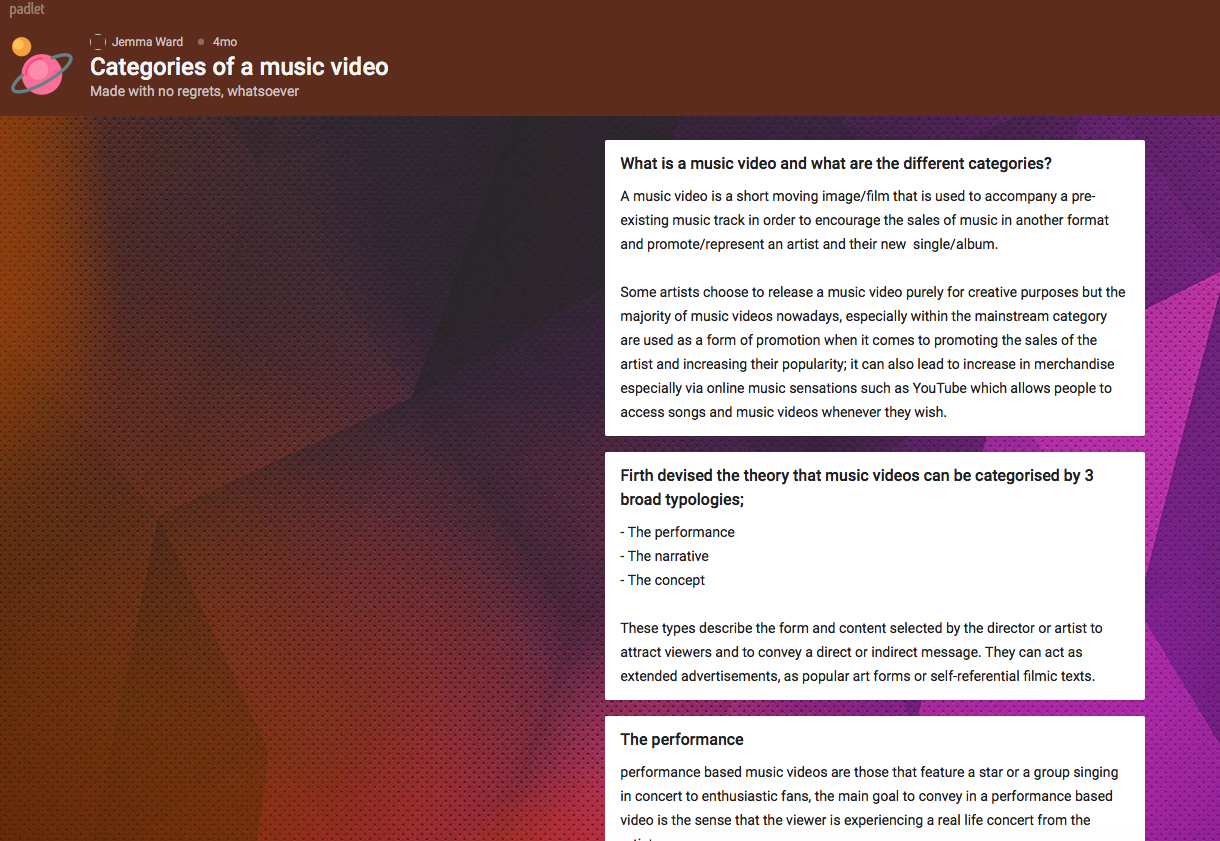
- Padlet is an online notebook, where I could create a 'board' which enabled me to add multiple different posts to an interactive board, this enabled my research to be organised, neat and interactive. It helped break up large pieces of text which made it more engaging for the reader.
- Enabling me to embed these into my blog posts allowed each post to be fun and interactive, this made it engaging. I tried to present each piece of research in a different way to keep each post interesting, all the different Web 2.0 tools enabled me to do so.
- These Web 2.0 tools allowed me to embed YouTube videos and add images to help explain my research to the reader/viewer.
- Throughout my blog posts I tried to present my work in different ways, to keep it interesting, with the Web 2.0 tools that I used I could achieve this, I was also able to make it interactive which I think is a great feature to keep the reader engaged.
Google
- Google has been my main search engine within my coursework, Blogger is a site linked to Google therefore it was a constant use, as I used my Google account for Blogger. I have also used Google to research different music videos, artists and the codes and conventions of the indie genre.
Google Images
- Using visual images it makes it easier for the reader/viewer to connect with my work and grasp what I am getting across, this helps me explain my research. I have used a lot of images from google as well as primary sourced images to keep the posts fun and engaging, and to enable my research to be represented well..