
Mind map
Limiting factor graphs
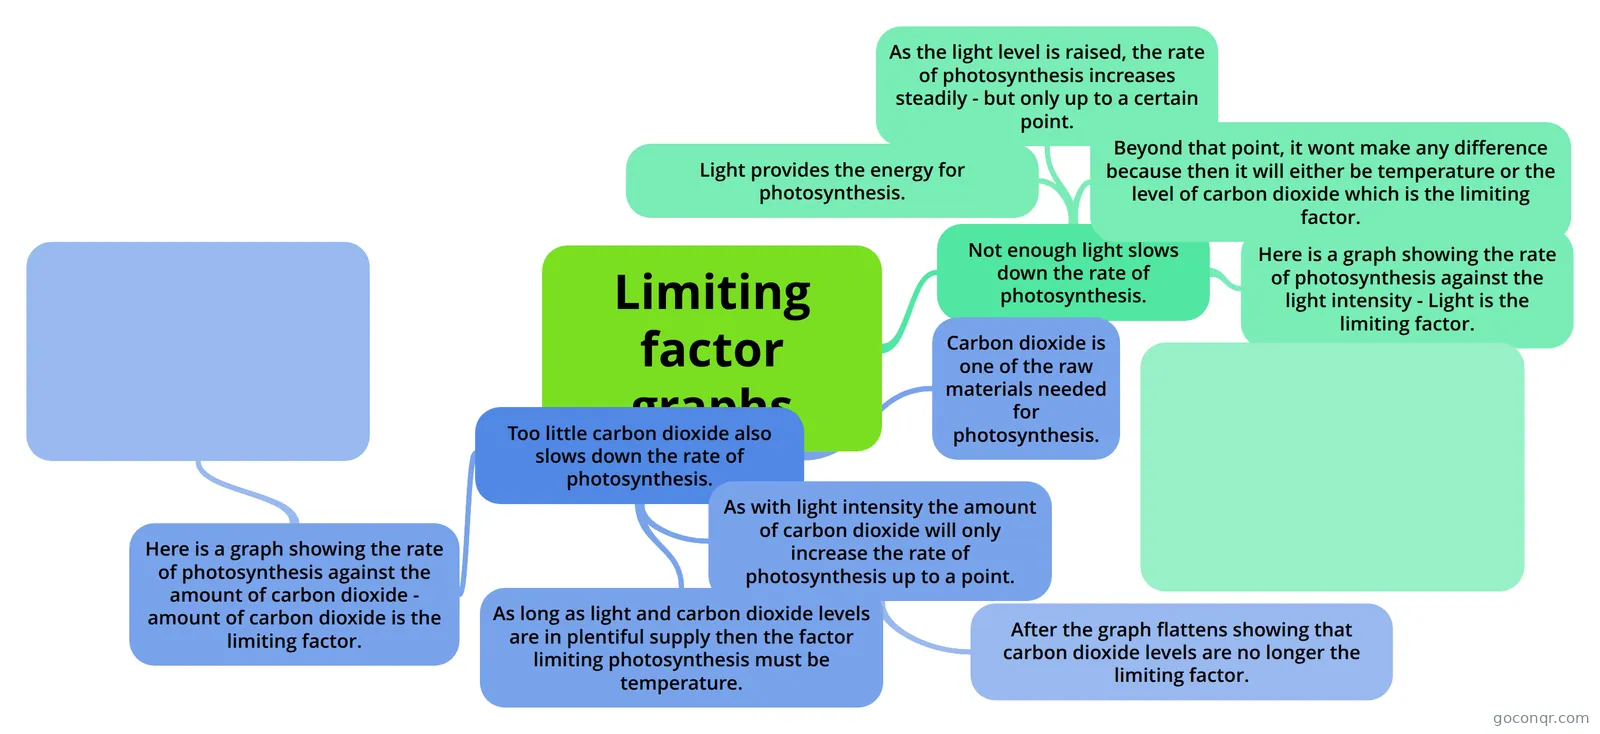
Mind map: limiting factor graphs
Map content
Limiting factor graphs
Not enough light slows down the rate of photosynthesis.
- Light provides the energy for photosynthesis.
- As the light level is raised, the rate of photosynthesis increases steadily - but only up to a certain point.
- Beyond that point, it wont make any difference because then it will either be temperature or the level of carbon dioxide which is the limiting factor.
- Here is a graph showing the rate of photosynthesis against the light intensity - Light is the limiting factor.
Too little carbon dioxide also slows down the rate of photosynthesis.
- Carbon dioxide is one of the raw materials needed for photosynthesis.
- As with light intensity the amount of carbon dioxide will only increase the rate of photosynthesis up to a point.
- After the graph flattens showing that carbon dioxide levels are no longer the limiting factor.
- As long as light and carbon dioxide levels are in plentiful supply then the factor limiting photosynthesis must be temperature.
- Here is a graph showing the rate of photosynthesis against the amount of carbon dioxide - amount of carbon dioxide is the limiting factor.
Information
- Description
- Biology Mind Map on Limiting factor graphs, created by jessica-gollop on 17/04/2013.
- Created by
- jessica-gollop
- Views
- 193
- Tags
- Rating