
Mind map
Bayesian networks
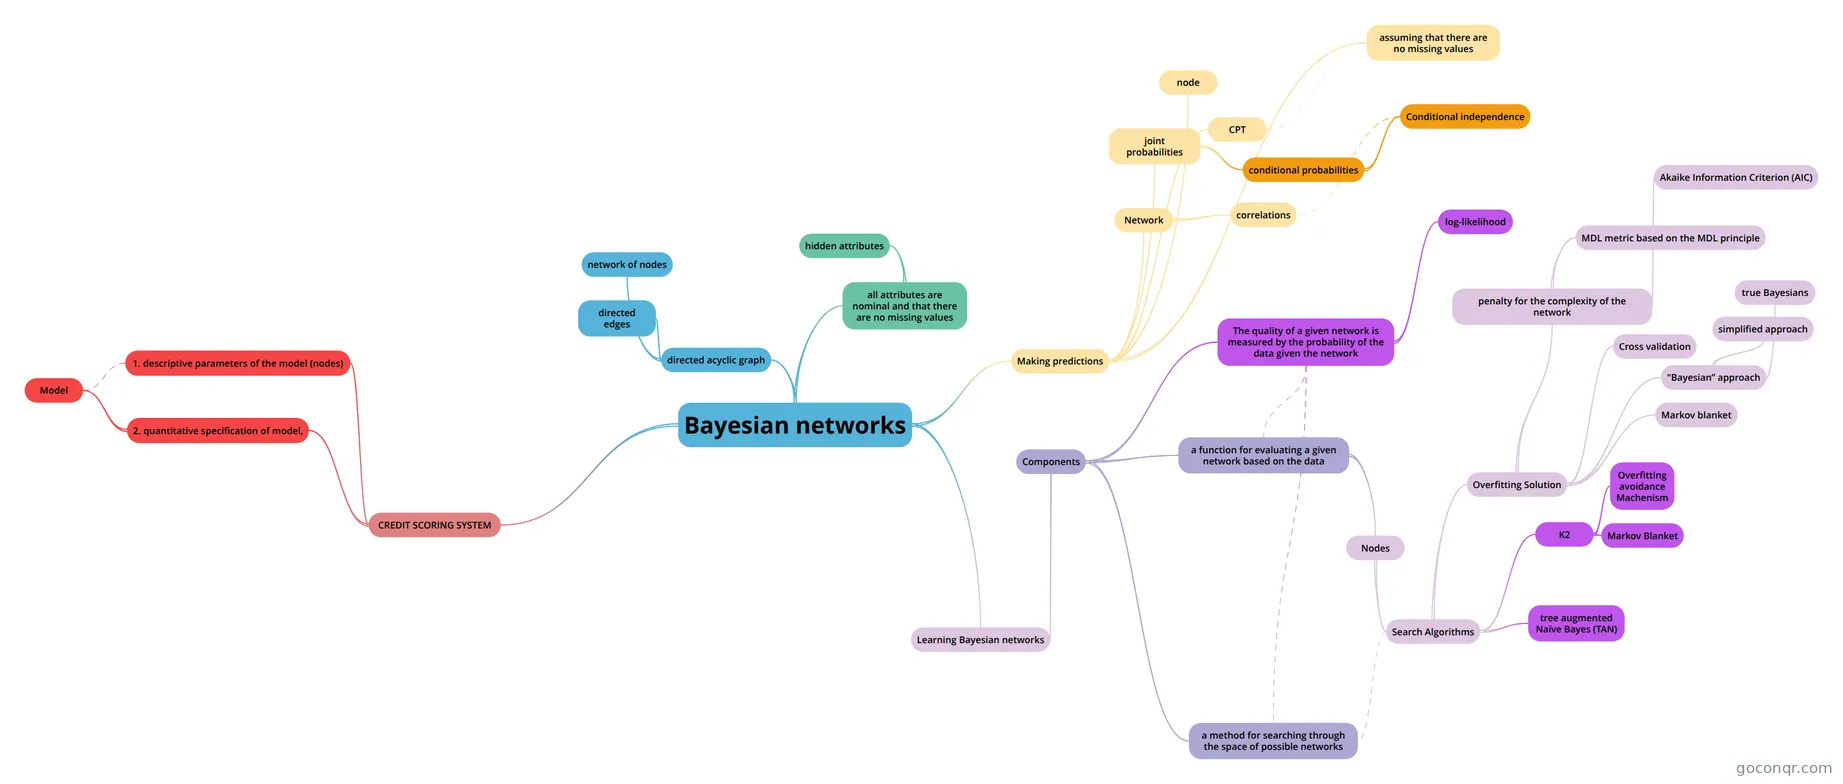
Mind map: Bayesian networks
Map content
Bayesian networks
- Viewed in this way, Naïve Bayes classifiers, logistic regression models, deci- sion trees, and so on, are just alternative ways of representing a conditional probability distribution. Of course, they differ in representational power. Naïve Bayes classifiers and logistic regression models can only represent simple distributions, whereas decision trees can represent—or at least approximate—arbitrary distributions. However, decision trees have their drawbacks: they frag- ment the training set into smaller and smaller pieces, which inevitably yield less reliable probability estimates, and they suffer from the replicated subtree problem described in Section 3.2. Rule sets go some way toward addressing these shortcomings, but the design of a good rule learner is guided by heuristics with scant theoretical justification.
- BN: a theoretically well-founded way of representing probability distributions concisely and comprehensibly in a graphical manner.
all attributes are nominal and that there are no missing values
- hidden attributes
- Some advanced learning algorithms can create new attributes in addition to the ones present in the data
- hidden attributes whose values cannot be observed
- support better models if they represent salient features of the underlying problem
- Bayesian networks provide a good way of using them at predic- tion time
- However, they make both learning and prediction far more complex and time consuming
- hidden attributes
directed acyclic graph
- network of nodes
- one for each attribute
- directed edges
- each attribute is connected by directed edges in such a way that there are no cycles
- network of nodes
Making predictions
- CPT
- On the left are the values of Parent, and on the right are the corresponding probabilities for each value of the attribute represented by the node.
- the left side contains a column for every edge pointing to the node
- each row of probabilities corresponds to one com- bination of values of the parent attributes the entries in the row show the probability of each value of the node’s attribute given this combination
- each row defines a probability distribution over the values of the node’s attribute. The entries in a row always sum to 1
- assuming that there are no missing values
- The instance specifies a value for each attribute
- node
- look up the probability of the node’s attribute value based on the row determined by its parents’ attribute values
- Then just multi- ply all these probabilities together.
- joint probabilities
- Pr[play = no,E] and Pr[play = yes,E], where E denotes all the evidence given by the instance’s attribute values
- Joint probabilities measure the likelihood of observing an instance that exhibits the attribute values in E as well as the respective class value
- They only sum to 1 if they exhaust the space of all possible attribute–value combinations, including the class attribute.
- conditional probabilities
- To obtain the conditional probabilities Pr [play = no|E] and Pr [play = yes|E], normalize the joint probabilities by dividing them by their sum.
- Conditional independence
- given values for each of a node’s parents, knowing the values for any other ancestors does not change the probability associated with each of its possible values.
- ancestors do not provide any information about the likelihood of the node’s values over and above the information pro- vided by the parents.
- Pr[node| ancestors] = Pr[node| parents], Multiplication is valid pro- vided that each node is conditionally independent of its grandparents, great- grandparents, and so on, given its parents.
- Network
- Different Bayesian net- works can be constructed for the same problem, representing exactly the same probability distribution.
- done by altering the way in which the joint probability distribution is factorized to exploit conditional independencies.
- The network whose directed edges model causal effects is often the simplest one with the fewest parameters.
- correlations
- when machine learning techniques are applied to induce models from data whose causal structure is unknown all they can do is con- struct a network based on the correlations that are observed in the data.
- CPT
Learning Bayesian networks
- Components
- The way to construct a learning algorithm for Bayesian networks is to define two components
- a function for evaluating a given network based on the data
- Nodes
- nodes in the network are predetermined, one for each attribute (includ- ing the class)
- Learning the network structure amounts to 1. searching through the space of possible sets of edges, 2.estimating the conditional probability tables for each set, and 3. computing the log-likelihood of the resulting network based on the data as a measure of the network’s quality.
- Bayesian network learning algorithms differ mainly in the way in which they search through the space of network structures.
- Search Algorithms
- Bayesian network learning algorithms differ mainly in the way in which they search through the space of network structures.
- If the log-likelihood is maximized based on the training data, it will always be better to add more edges: the resulting network will simply overfit.
- Overfitting Solution
- penalty for the complexity of the network
- .penalty for the complexity of the network based on the number of parameters, that is, the total number of independent estimates in all the probability tables.
- For each table, the number of independent probabilities = total number of entries - the number of entries in the last column which can be determined from the other columns because all rows must sum to 1
- log-likelihood is negated, so the aim is to minimize these scores.
- K = the number of parameters, LL = the log-likelihood, and N = the number of instances in the data
- Akaike Information Criterion (AIC)
- AIC score = - LL + K ,
- MDL metric based on the MDL principle
- MDL score = - LL + K/2 log N .
- Cross validation
- "Bayesian” approach
- assign a prior distribution over network structures and find the most likely network by combining its prior probability with the probability accorded to the network by the data.
- Depending on the prior distribution used, it can take various forms
- assign a prior distribution over network structures and find the most likely network by combining its prior probability with the probability accorded to the network by the data Depending on the prior distribution used, it can take various forms.
- true Bayesians
- true Bayesians would average over all possible network structures rather than singling out a particular network for prediction. Unfor- tunately, this generally requires a great deal of computation.
- simplified approach
- average over all network structures that are substructures of a given network. I
- It turns out that this can be implemented very efficiently by changing the method for calculating the conditional probability tables so that the resulting probability estimates implicitly contain information from all sub-networks.
- Markov blanket
- ensure that every attribute in the data is in the Markov blanket of the node that represents the class attribute.
- A node’s Markov blanket includes all its parents, children, and children’s parents.
- It can be shown that a node is conditionally independent of all other nodes given values for the nodes in its Markov blanket.
- if a node is absent from the class attribute’s Markov blanket, its value is completely irrelevant to the classi- fication.
- penalty for the complexity of the network
- K2
- simple and very fast learning algorithm
- starts with a given ordering of the attributes (i.e., nodes) Then processes each node in turn and greedily considers adding edges from previously processed nodes to the current one.
- each step it adds the edge that maximizes the network’s score. When there is no further improvement, attention turns to the next node.
- Overfitting avoidance Machenism
- the number of parents for each node can be restricted to a predefined maximum
- However, the result depends on the initial ordering, so it makes sense to run the algorithm several times with different random orderings.
- Markov Blanket
- if K2 finds a network that does not include a relevant attrib- ute in the class node’s Markov blanket, it might help to add an edge that rectifies this shortcoming.
- A simple way of doing this is to add an edge from the attribute’s node to the class node or from the class node to the attribute’s node, depending on which option avoids a cycle.
- tree augmented Naïve Bayes (TAN)
- it takes the Naïve Bayes classifier and adds edges to it
- The class attribute is the single parent of each node of a Naïve Bayes network: TAN considers adding a second parent to each node.
- If the class node and all corresponding edges are excluded from consid- eration, and assuming that there is exactly one node to which a second parent is not added, the resulting classifier has a tree structure rooted at the parentless node—this is where the name comes from.
- This algorithm is linear in the number of instances and quadratic in the number of attributes.
- Tree Augmented Naive Bayes where the tree is formed by calculating the maximum weight spanning tree using Chow and Liu algo- rithm
- Nodes
- a method for searching through the space of possible networks
- The quality of a given network is measured by the probability of the data given the network
- calculate the probability that the network accords to each instance and multiply these probabilities together over all instances
- this quickly yields numbers too small to be represented properly (called arithmetic underflow), so we use the sum of the logarithms of the probabilities rather than their product.
- log-likelihood
- The resulting quantity is the log-likelihood of the network given the data.
- Components
CREDIT SCORING SYSTEM
- The Bayesian model is a result of formal encoding of the domain expert knowledge, the factors influencing the phenomenon and their mutual interactions.
- 1. descriptive parameters of the model (nodes)
- At first the primary goal is defining descriptive parameters of the model
- the domain expert has a crucial work to do. The topology of network and its detailed nature is then specified.
- Unspecified parameters, lacking or misdirected connections between nodes result in inconsistencies of model, ambiguity of causal relationships and finally in inaccuracy of expertise.
- 2. quantitative specification of model,
- requires filling-up conditional probability tables. The computer aided, statistical analysis of historical data can reveal strength of causal dependencies between nodes. During all procedures the domain expert can moderate generation process.
- Model
- The aim of the economic model we work with in this article is to analyze standing of an enterprise from crediting banks’ perspective. We defined nine groups of factors (i.e. scope of analysis) used to classify customers according to credit risk- level.