
Mapa mental
RESEARCH METHODS
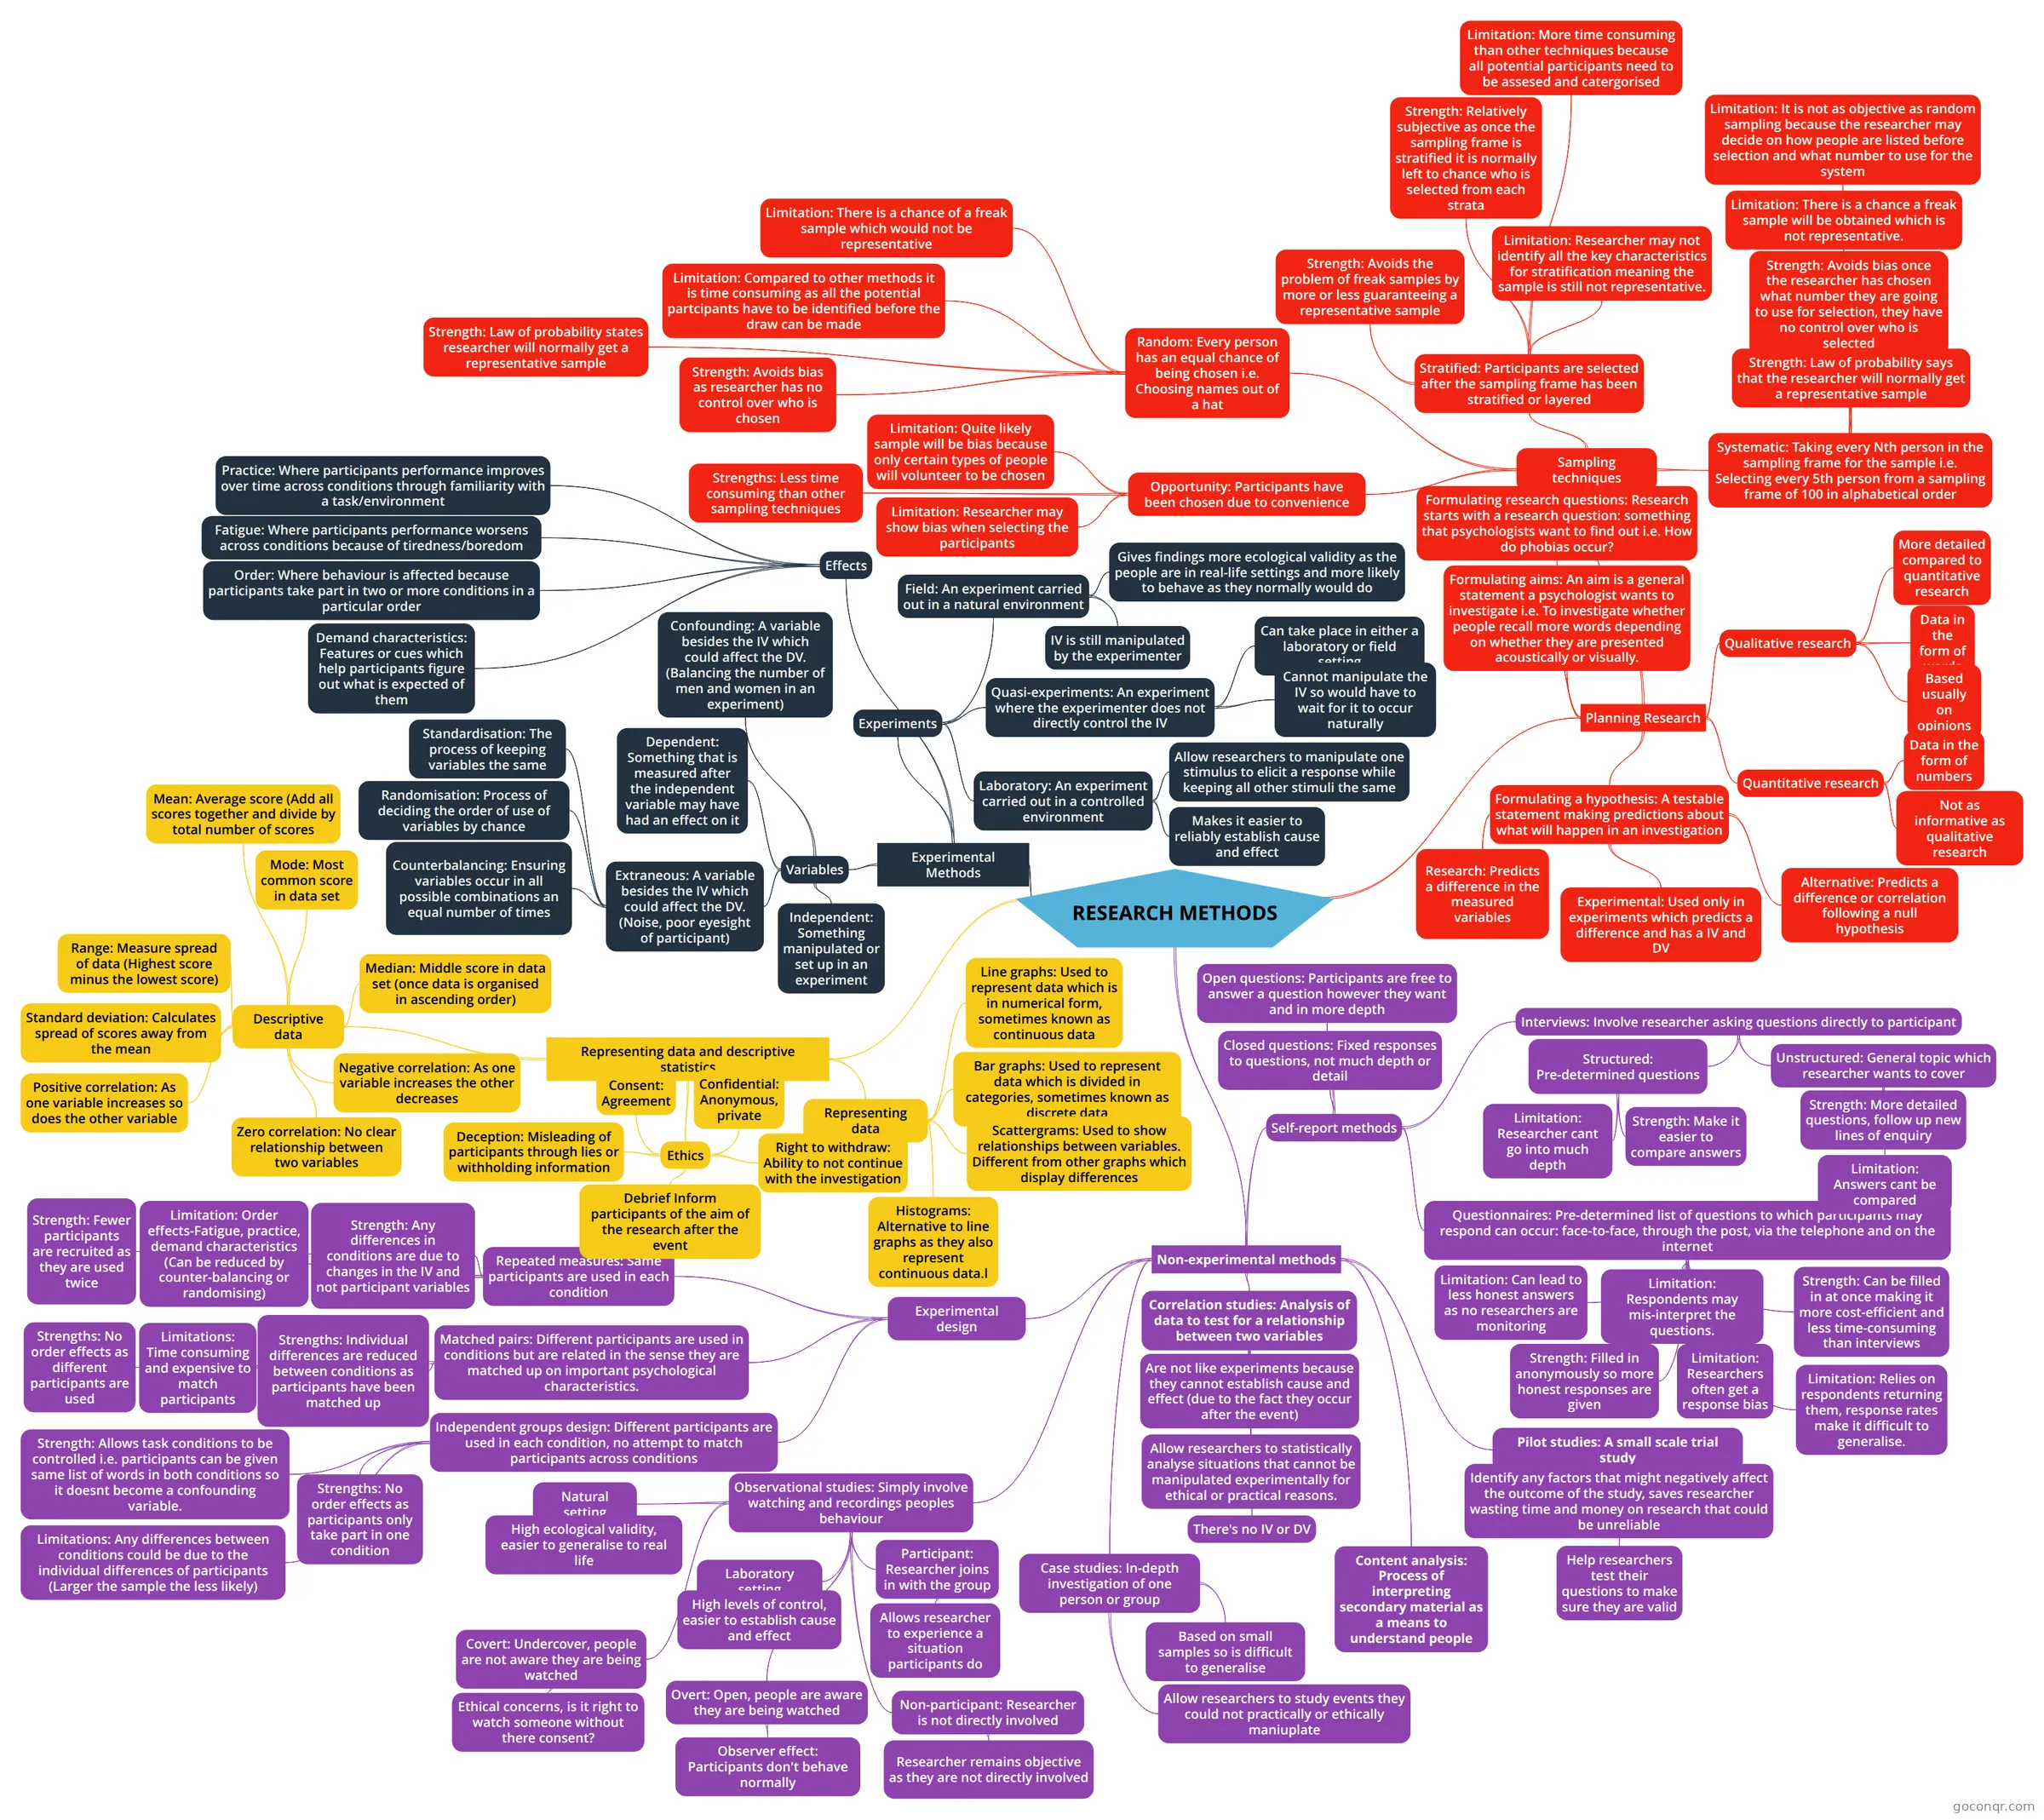
Mind map: Research methods in psychology
Contenido del mapa
RESEARCH METHODS
Planning Research
- Quantitative research
- Data in the form of numbers
- Not as informative as qualitative research
- Qualitative research
- Data in the form of words
- Based usually on opinions
- More detailed compared to quantitative research
- Formulating research questions: Research starts with a research question: something that psychologists want to find out i.e. How do phobias occur?
- Formulating aims: An aim is a general statement a psychologist wants to investigate i.e. To investigate whether people recall more words depending on whether they are presented acoustically or visually.
- Formulating a hypothesis: A testable statement making predictions about what will happen in an investigation
- Experimental: Used only in experiments which predicts a difference and has a IV and DV
- Alternative: Predicts a difference or correlation following a null hypothesis
- Research: Predicts a difference in the measured variables
- Sampling techniques
- Random: Every person has an equal chance of being chosen i.e. Choosing names out of a hat
- Strength: Avoids bias as researcher has no control over who is chosen
- Strength: Law of probability states researcher will normally get a representative sample
- Limitation: There is a chance of a freak sample which would not be representative
- Limitation: Compared to other methods it is time consuming as all the potential partcipants have to be identified before the draw can be made
- Stratified: Participants are selected after the sampling frame has been stratified or layered
- Strength: Avoids the problem of freak samples by more or less guaranteeing a representative sample
- Strength: Relatively subjective as once the sampling frame is stratified it is normally left to chance who is selected from each strata
- Limitation: More time consuming than other techniques because all potential participants need to be assesed and catergorised
- Limitation: Researcher may not identify all the key characteristics for stratification meaning the sample is still not representative.
- Systematic: Taking every Nth person in the sampling frame for the sample i.e. Selecting every 5th person from a sampling frame of 100 in alphabetical order
- Strength: Avoids bias once the researcher has chosen what number they are going to use for selection, they have no control over who is selected
- Strength: Law of probability says that the researcher will normally get a representative sample
- Limitation: There is a chance a freak sample will be obtained which is not representative.
- Limitation: It is not as objective as random sampling because the researcher may decide on how people are listed before selection and what number to use for the system
- Opportunity: Participants have been chosen due to convenience
- Strengths: Less time consuming than other sampling techniques
- Limitation: Quite likely sample will be bias because only certain types of people will volunteer to be chosen
- Limitation: Researcher may show bias when selecting the participants
- Random: Every person has an equal chance of being chosen i.e. Choosing names out of a hat
- Quantitative research
Experimental Methods
- Experiments
- Field: An experiment carried out in a natural environment
- IV is still manipulated by the experimenter
- Gives findings more ecological validity as the people are in real-life settings and more likely to behave as they normally would do
- Laboratory: An experiment carried out in a controlled environment
- Allow researchers to manipulate one stimulus to elicit a response while keeping all other stimuli the same
- Makes it easier to reliably establish cause and effect
- Quasi-experiments: An experiment where the experimenter does not directly control the IV
- Can take place in either a laboratory or field setting
- Cannot manipulate the IV so would have to wait for it to occur naturally
- Field: An experiment carried out in a natural environment
- Variables
- Independent: Something manipulated or set up in an experiment
- Dependent: Something that is measured after the independent variable may have had an effect on it
- Extraneous: A variable besides the IV which could affect the DV. (Noise, poor eyesight of participant)
- Standardisation: The process of keeping variables the same
- Counterbalancing: Ensuring variables occur in all possible combinations an equal number of times
- Randomisation: Process of deciding the order of use of variables by chance
- Confounding: A variable besides the IV which could affect the DV. (Balancing the number of men and women in an experiment)
- Effects
- Order: Where behaviour is affected because participants take part in two or more conditions in a particular order
- Practice: Where participants performance improves over time across conditions through familiarity with a task/environment
- Fatigue: Where participants performance worsens across conditions because of tiredness/boredom
- Demand characteristics: Features or cues which help participants figure out what is expected of them
- Experiments
Non-experimental methods
- Experimental design
- Repeated measures: Same participants are used in each condition
- Strength: Any differences in conditions are due to changes in the IV and not participant variables
- Strength: Fewer participants are recruited as they are used twice
- Limitation: Order effects-Fatigue, practice, demand characteristics (Can be reduced by counter-balancing or randomising)
- Matched pairs: Different participants are used in conditions but are related in the sense they are matched up on important psychological characteristics.
- Strengths: No order effects as different participants are used
- Strengths: Individual differences are reduced between conditions as participants have been matched up
- Limitations: Time consuming and expensive to match participants
- Independent groups design: Different participants are used in each condition, no attempt to match participants across conditions
- Strengths: No order effects as participants only take part in one condition
- Strength: Allows task conditions to be controlled i.e. participants can be given same list of words in both conditions so it doesnt become a confounding variable.
- Limitations: Any differences between conditions could be due to the individual differences of participants (Larger the sample the less likely)
- Repeated measures: Same participants are used in each condition
- Self-report methods
- Questionnaires: Pre-determined list of questions to which participants may respond can occur: face-to-face, through the post, via the telephone and on the internet
- Strength: Can be filled in at once making it more cost-efficient and less time-consuming than interviews
- Limitation: Relies on respondents returning them, response rates make it difficult to generalise.
- Limitation: Researchers often get a response bias
- Strength: Filled in anonymously so more honest responses are given
- Limitation: Can lead to less honest answers as no researchers are monitoring
- Limitation: Respondents may mis-interpret the questions.
- Interviews: Involve researcher asking questions directly to participant
- Structured: Pre-determined questions
- Strength: Make it easier to compare answers
- Limitation: Researcher cant go into much depth
- Unstructured: General topic which researcher wants to cover
- Strength: More detailed questions, follow up new lines of enquiry
- Limitation: Answers cant be compared
- Structured: Pre-determined questions
- Open questions: Participants are free to answer a question however they want and in more depth
- Closed questions: Fixed responses to questions, not much depth or detail
- Questionnaires: Pre-determined list of questions to which participants may respond can occur: face-to-face, through the post, via the telephone and on the internet
- Pilot studies: A small scale trial study
- Help researchers test their questions to make sure they are valid
- Identify any factors that might negatively affect the outcome of the study, saves researcher wasting time and money on research that could be unreliable
- Correlation studies: Analysis of data to test for a relationship between two variables
- Are not like experiments because they cannot establish cause and effect (due to the fact they occur after the event)
- There's no IV or DV
- Allow researchers to statistically analyse situations that cannot be manipulated experimentally for ethical or practical reasons.
- Observational studies: Simply involve watching and recordings peoples behaviour
- Natural setting
- High ecological validity, easier to generalise to real life
- Laboratory setting
- High levels of control, easier to establish cause and effect
- Covert: Undercover, people are not aware they are being watched
- Ethical concerns, is it right to watch someone without there consent?
- Overt: Open, people are aware they are being watched
- Observer effect: Participants don't behave normally
- Participant: Researcher joins in with the group
- Allows researcher to experience a situation participants do
- Non-participant: Researcher is not directly involved
- Researcher remains objective as they are not directly involved
- Natural setting
- Content analysis: Process of interpreting secondary material as a means to understand people
- Case studies: In-depth investigation of one person or group
- Based on small samples so is difficult to generalise
- Allow researchers to study events they could not practically or ethically maniuplate
- Experimental design
Representing data and descriptive statistics
- Representing data
- Bar graphs: Used to represent data which is divided in categories, sometimes known as discrete data
- Line graphs: Used to represent data which is in numerical form, sometimes known as continuous data
- Histograms: Alternative to line graphs as they also represent continuous data.l
- Scattergrams: Used to show relationships between variables. Different from other graphs which display differences
- Descriptive data
- Mode: Most common score in data set
- Mean: Average score (Add all scores together and divide by total number of scores
- Median: Middle score in data set (once data is organised in ascending order)
- Range: Measure spread of data (Highest score minus the lowest score)
- Standard deviation: Calculates spread of scores away from the mean
- Positive correlation: As one variable increases so does the other variable
- Negative correlation: As one variable increases the other decreases
- Zero correlation: No clear relationship between two variables
- Ethics
- Confidential: Anonymous, private
- Consent: Agreement
- Deception: Misleading of participants through lies or withholding information
- Right to withdraw: Ability to not continue with the investigation
- Debrief Inform participants of the aim of the research after the event
- Representing data
Información
- Descripción
- A-Level Psychology Mapa Mental sobre RESEARCH METHODS, creado por arshadgani el 28/04/2015.
- Creado por
- arshadgani
- Visitas
- 1
- Valoración