
Flashcards
UNIT 6
Cards in this deck (35)
- 1An analysis involving just 2 variables can be described as addressing a/an questionfocused
- 2An analysis involving more than 2 variables can be described as addressing a/an questionomnibus
- 3If a correlation is .5, what is the percent of variance explained?.25 (correlation squared)
- 4. Consider the following example: Zara’s score on x = 5 Zara’s score on y = 23 B0 = 10 b1 = 2 What is ?HAT for Zara?B0+b1(x) = 20
What is e for Zara? = 3 - 5Answer the following questions using the key: In the regression equation, what is B0? ? B In the regression equation, what is B1? A In the regression equation, what is e? DA. The expected increase in y given a one unit increase in x
B. The expected value for y when x equals zero
C. A person’s predicted score on the outcome variable
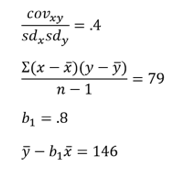
D. Observed y minus predicted y - 6Assume you get the following results in a study.what is the expected increase in y if there is a one unit increase in x? .8
What is the expected value for y when x equals zero? 141
If x = 5, what is ?hat?
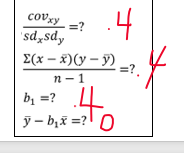
(5 x .8) + 146 = 150 - 7Assume that, after getting these results, you turn all the variables into z-scores and recalculate everything. What would the new values be?
- 8In least squares regression, we calculate an intercept and a slope to minimize something. Write the formula for the thing that gets minimizedsum(y-yhat)^2
- 9Use “cov_xy” as the symbol for the covariance between x and y and write the formula for a slope. Note: If a component of the equation needs both a superscript and a subscript, it does not matter which you type first and which you type second. The lecture video provides two ways of writing the formula for a slope, and either way will be counted correct.cov_xy/sd^2_x
- 10In simple regression when x and y are standardized . . . a beta will always equal: _____ an intercept will always equal: ______the correlation
zero - 11For a simple regression with one predictor variable, Write the full linear regression equation for variance in a sample. Note: The equation should include subscripts.y_is=b_0s+(b_1s)(x_is)+e_is
- 12For a simple regression with one predictor variable, there are two equations for sampling error variance in a population. To write the most important of these two equations, you would need to include the term “e_1sp.” Write this linear equation for sampling error variance in a population that includes the term “e_1sp.” Note: The equation should include subscripts.b_1sp=beta_1p+e_1sp
- 13For a simple regression with one predictor variable, there are two equations for sampling error variance in a population. To write the least important of these two equations, you would need to include the term “e_0sp.” Write this linear equation for sampling error variance in a population that includes the term “e_0sp.” Note: The equation should include subscripts.b_0sp=beta_0p+e_0sp
- 14As ___ gets steeper, ?(? − ?hat) gets .b1
smaller - 15Use “ss_est” as the symbol for the sum of squared error and write the formula for the standard error of estimate.sqrt(ss_est/(n-2))
- 16?(? − ?hat)2 is the sum of squareserror
- 17?(? − ?bar)2 is the sum of squarestotal
- 18?(?hat − ?bar)2 is the sum of squaresexplained
- 19Answer the questions about this equation. y_is=b_0s+(b_1s )(x_is)=e_is In the above equation, what is the average deviation of |eis|?the standard error of estimate
- 20in the above how is e_is calculatedy-yhat
- 21In simple regression, if r = 0, then. . .the intercept is equal to the mean of y
the sum of squares error is equal to sum of squares total
the sum of squares explained is equal to zero
the sum of squares total is equal to sum of squares error - 22In simple regression, if r = 1, then. . .the sum of squares error is equal to ZERO
the sum of squares explained is equal to SS Total
the sum of squares total is equal to SS Explained - 23. Imagine that you do a study and find that the total sum of squares is 12 and the error sum of squares is 9. What is the explained variance sum of squares? What is the r2 ? (% of variance explained) == 3 (total-error=explained)
3/12 = .25 - 24—If this study were repeated over and over, how much will the beta typically deviate from the true population parameter? (1.5/.25) = 6
Calculate the value that indicates the standardized e1sp for this study assuming Ho is true. T test, = 6
Calculate the t-value for the correlation. Same as beta = 6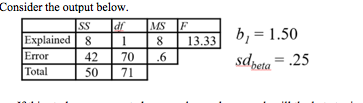
- 25—Given the output above, calculate r2. = .25 (30/90)
Calculate the value that indicates the average distance that people’s predicted scores deviated from their observed scores. = sqrt(90/10) = 3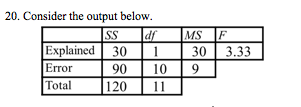
- 26—Which cell is equal to ?(? − ?bar)2 ? H
Which cell is equal to ?(?hat− ?bar)2 ? A
Which cell is equal to ?(? − ?hat)2 ?D
Which cell is equal to p (number of Bpredictors)? Which cell is equal to n – p – 1? E
Which cell is equal to n – 1 ? I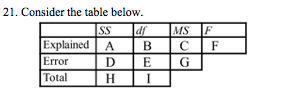
- 27You define “fish time” as the number of hours a person spends with pet fish in one week. You do a study using fish time to predict ratings of life well-being, and get these results: b0 = 8 and b1 = 3. Lou was a participant in the study, and Lou’s fish time was 4 hours. What is Lou’s predicted life wellbeing?Yhat= b0+b1x predicted = 20
If Lou’s actual life wellbeing score was 25, what is Lou’s life wellbeing with fish time extracted out of it? E = y – yhat, E = 5 - 28You have scores on variable x and variable y for a sample of people. You extract x out of y to create variable e. If the correlation between x and y is zero, then. . .the correlation between x and e is equal to ZERO
? − yhat is equal to y-ybar
?bar is equal to 0
Sde is equal to sdy - 29You have scores on variable x and variable y for a sample of people. You extract x out of y to create variable e. If there is a perfect correlation between x and y, then. . .the correlation between x and e is equal to ZERO
? − ?hat is equal to ZERO
?bar is equal to ZERO
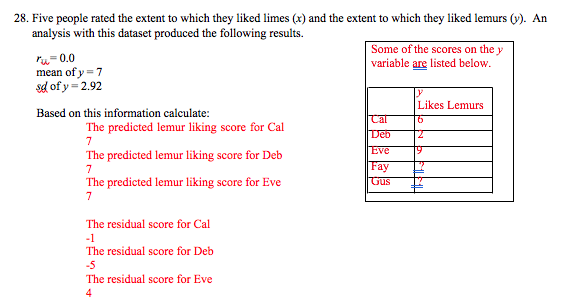
Sde is equal to ZERO - 30—The predicted owl liking score for Cal = 3.4+(0.3)1 =3.7
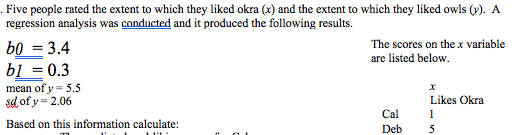
- 31—actual y - predicted y
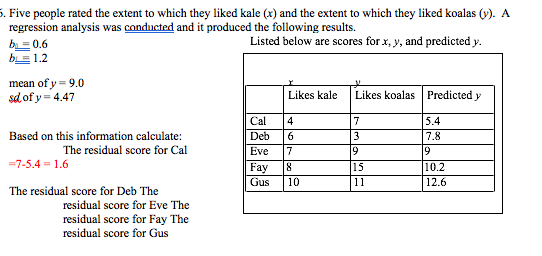
- 32What is the correlation between the residual scores you just created and the scores on x (likes kale)?ZERO
- 33—

- 34—

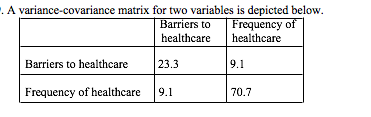
- 35What is the beta weight if barriers to healthcare is used to predict frequency of healthcare? What is the standardized beta weight if barriers to healthcare is used to predict frequency of healthcare? The top left cell in the table has a value of 23.3. What would this value in the table become if all the variables were turned to z-scores prior to analysis? The top right cell in the table has a value of 9.1. What would this value in the table become if all the variables were turned to z-scores prior to analysis???????
Information
- Description
- Flashcards on UNIT 6 , created by abbi gutierrez on 05/04/2021.
- Created by
- abbi gutierrez
- Views
- 1
- Rating