878527
| Question | Answer |
| If r = .25, then β = ? | β = .25. because pearsons r is equal to β weight in a regression analysis. B tells you the strength that the IV predicts the DV. β is the same thing but the error or variability is inside. |
| y on a graph is? | always the independent variable. Constant is the "intercept." The coefficient is always multiplied by x |
| y=constant+b₁(x)+e | This is the expression of a linear regression and this is what we would include in our inferential statistics. |
| Error in the output of a regression in SPSS | Does not show up. But you can work it out using the residuals |
| b₁ | refers to the B in the output. (this is the unstandardised regression coefficient) |
| Graphing the regression requires which peice of information from the output | It requires the B, and the mean from teh descriptive statistics |
| In practise what do you report on a regression line? | the r squared value (usually the adjusted one), the Beta value and its related p-value. |
|
Image:
Picture1 (image/png)
|
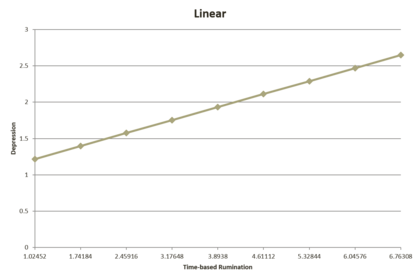
The r & β values are both moderately positive so you would expect the graph to also be moderately positive. In the graph the middle point is the mean and each arithmetic stop up is one Standard Deviation from that mean |
| R squared is? | The amount of variance explained by the predictor, the bigger the value the better. Adjusted R squared values are usually reported. If R squared value is .24, then you can tentatively suggest that 24% of the variance of x was predicted by y |
| Linear vs. Multiple regression | A linear regression uses only one predictor or IV, a multiple regression uses more than one predictor but still only one DV. |
| Obscured Variance | If there are IVs that are excessively correlated (over .8) then you may have a problem of multicollinearity. This would result in some of the less significant IVs being reported as non-significant. When doing individual regressions with each IV however you will see their significance. A solution would be excluding the highly correlated variables or combining them. |
Want to create your own Flashcards for free with GoConqr? Learn more.