
Mind map
Research Methods
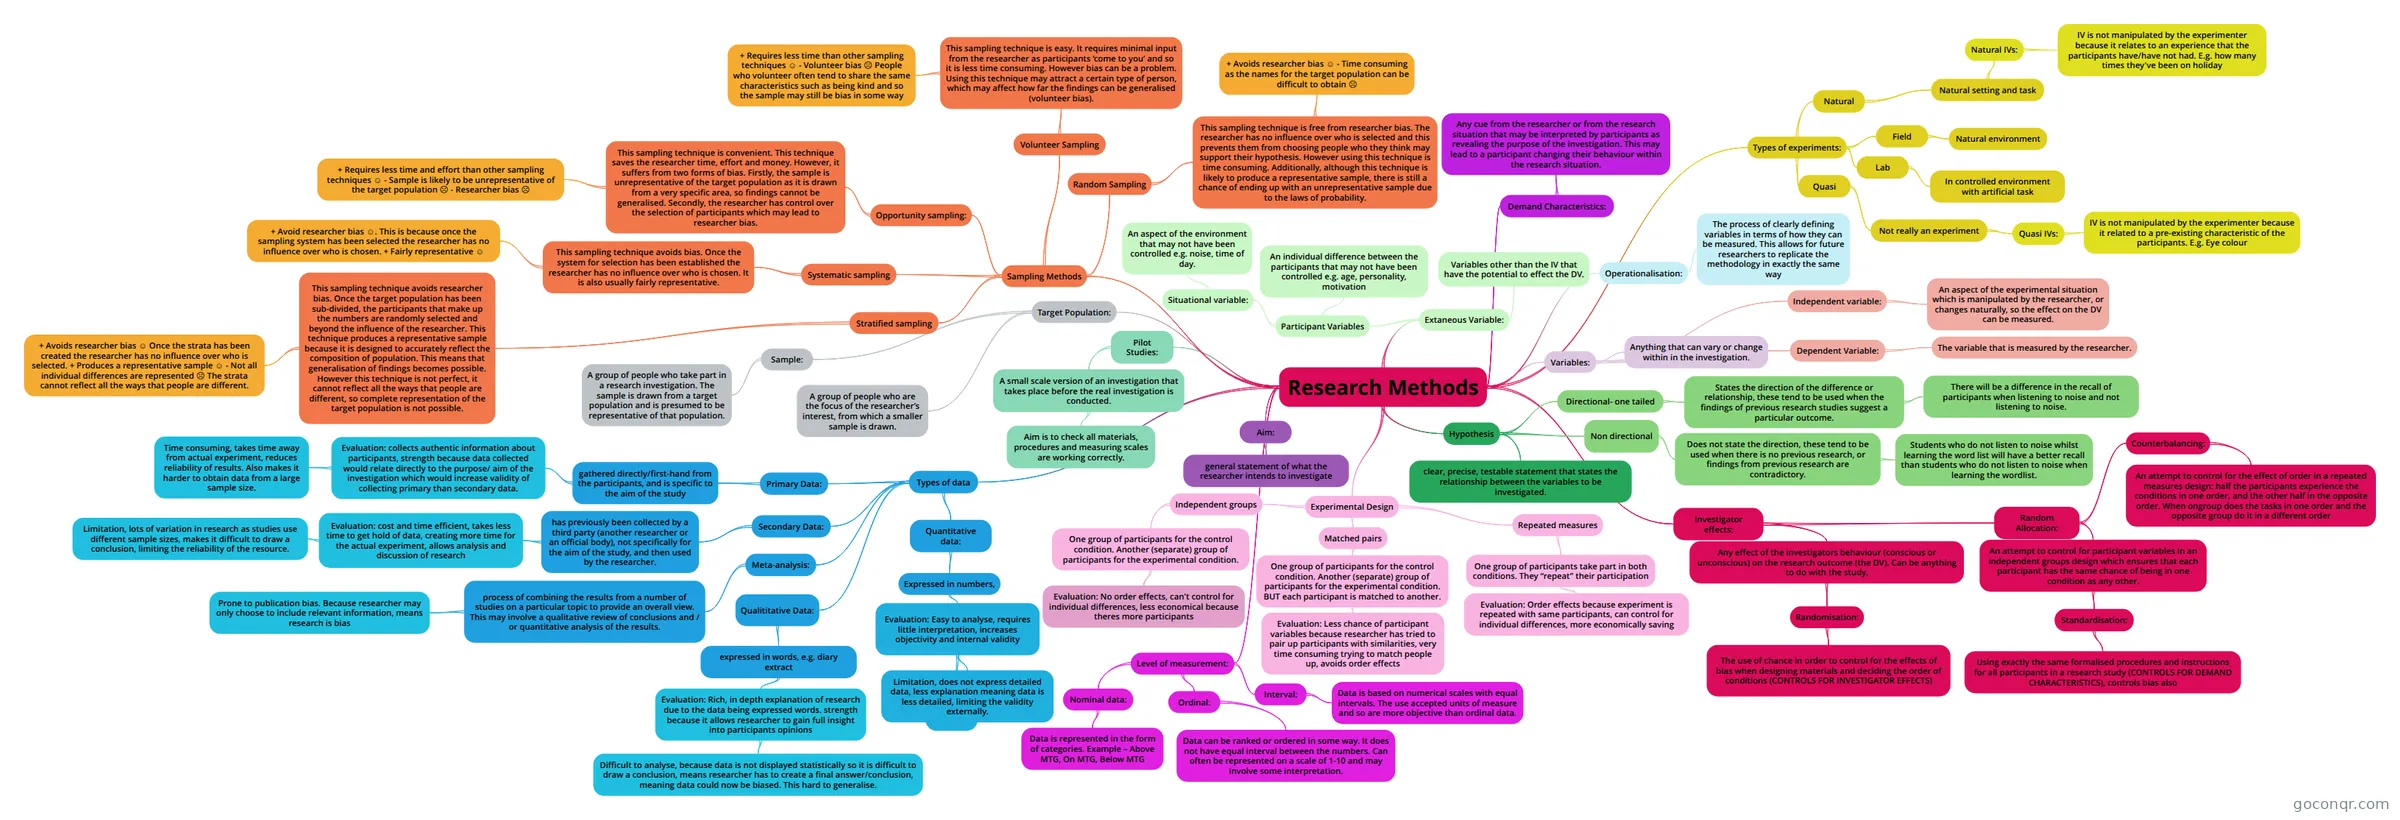
Mind map: Research Methods
Map content
Research Methods
Aim:
- general statement of what the researcher intends to investigate
Hypothesis
- clear, precise, testable statement that states the relationship between the variables to be investigated.
- Directional- one tailed
- States the direction of the difference or relationship, these tend to be used when the findings of previous research studies suggest a particular outcome.
- There will be a difference in the recall of participants when listening to noise and not listening to noise.
- States the direction of the difference or relationship, these tend to be used when the findings of previous research studies suggest a particular outcome.
- Non directional
- Does not state the direction, these tend to be used when there is no previous research, or findings from previous research are contradictory.
- Students who do not listen to noise whilst learning the word list will have a better recall than students who do not listen to noise when learning the wordlist.
- Does not state the direction, these tend to be used when there is no previous research, or findings from previous research are contradictory.
Variables:
- Anything that can vary or change within in the investigation.
- Independent variable:
- An aspect of the experimental situation which is manipulated by the researcher, or changes naturally, so the effect on the DV can be measured.
- Dependent Variable:
- The variable that is measured by the researcher.
Operationalisation:
- The process of clearly defining variables in terms of how they can be measured. This allows for future researchers to replicate the methodology in exactly the same way
Extaneous Variable:
- Variables other than the IV that have the potential to effect the DV.
- Participant Variables
- An individual difference between the participants that may not have been controlled e.g. age, personality, motivation
- Situational variable:
- An aspect of the environment that may not have been controlled e.g. noise, time of day.
Target Population:
- A group of people who are the focus of the researcher’s interest, from which a smaller sample is drawn.
- Sample:
- A group of people who take part in a research investigation. The sample is drawn from a target population and is presumed to be representative of that population.
Sampling Methods
- Random Sampling
- This sampling technique is free from researcher bias. The researcher has no influence over who is selected and this prevents them from choosing people who they think may support their hypothesis. However using this technique is time consuming. Additionally, although this technique is likely to produce a representative sample, there is still a chance of ending up with an unrepresentative sample due to the laws of probability.
- + Avoids researcher bias ☺ - Time consuming as the names for the target population can be difficult to obtain ☹
- This sampling technique is free from researcher bias. The researcher has no influence over who is selected and this prevents them from choosing people who they think may support their hypothesis. However using this technique is time consuming. Additionally, although this technique is likely to produce a representative sample, there is still a chance of ending up with an unrepresentative sample due to the laws of probability.
- Volunteer Sampling
- This sampling technique is easy. It requires minimal input from the researcher as participants ‘come to you’ and so it is less time consuming. However bias can be a problem. Using this technique may attract a certain type of person, which may affect how far the findings can be generalised (volunteer bias).
- + Requires less time than other sampling techniques ☺ - Volunteer bias ☹ People who volunteer often tend to share the same characteristics such as being kind and so the sample may still be bias in some way
- This sampling technique is easy. It requires minimal input from the researcher as participants ‘come to you’ and so it is less time consuming. However bias can be a problem. Using this technique may attract a certain type of person, which may affect how far the findings can be generalised (volunteer bias).
- Systematic sampling
- This sampling technique avoids bias. Once the system for selection has been established the researcher has no influence over who is chosen. It is also usually fairly representative.
- + Avoid researcher bias ☺. This is because once the sampling system has been selected the researcher has no influence over who is chosen. + Fairly representative ☺
- This sampling technique avoids bias. Once the system for selection has been established the researcher has no influence over who is chosen. It is also usually fairly representative.
- Opportunity sampling:
- This sampling technique is convenient. This technique saves the researcher time, effort and money. However, it suffers from two forms of bias. Firstly, the sample is unrepresentative of the target population as it is drawn from a very specific area, so findings cannot be generalised. Secondly, the researcher has control over the selection of participants which may lead to researcher bias.
- + Requires less time and effort than other sampling techniques ☺ - Sample is likely to be unrepresentative of the target population ☹ - Researcher bias ☹
- This sampling technique is convenient. This technique saves the researcher time, effort and money. However, it suffers from two forms of bias. Firstly, the sample is unrepresentative of the target population as it is drawn from a very specific area, so findings cannot be generalised. Secondly, the researcher has control over the selection of participants which may lead to researcher bias.
- Stratified sampling
- This sampling technique avoids researcher bias. Once the target population has been sub-divided, the participants that make up the numbers are randomly selected and beyond the influence of the researcher. This technique produces a representative sample because it is designed to accurately reflect the composition of population. This means that generalisation of findings becomes possible. However this technique is not perfect, it cannot reflect all the ways that people are different, so complete representation of the target population is not possible.
- + Avoids researcher bias ☺ Once the strata has been created the researcher has no influence over who is selected. + Produces a representative sample ☺ - Not all individual differences are represented ☹ The strata cannot reflect all the ways that people are different.
- This sampling technique avoids researcher bias. Once the target population has been sub-divided, the participants that make up the numbers are randomly selected and beyond the influence of the researcher. This technique produces a representative sample because it is designed to accurately reflect the composition of population. This means that generalisation of findings becomes possible. However this technique is not perfect, it cannot reflect all the ways that people are different, so complete representation of the target population is not possible.
- Random Sampling
Experimental Design
- Independent groups
- One group of participants for the control condition. Another (separate) group of participants for the experimental condition.
- Evaluation: No order effects, can't control for individual differences, less economical because theres more participants
- One group of participants for the control condition. Another (separate) group of participants for the experimental condition.
- Matched pairs
- One group of participants for the control condition. Another (separate) group of participants for the experimental condition. BUT each participant is matched to another.
- Evaluation: Less chance of participant variables because researcher has tried to pair up participants with similarities, very time consuming trying to match people up, avoids order effects
- One group of participants for the control condition. Another (separate) group of participants for the experimental condition. BUT each participant is matched to another.
- Repeated measures
- One group of participants take part in both conditions. They “repeat” their participation
- Evaluation: Order effects because experiment is repeated with same participants, can control for individual differences, more economically saving
- One group of participants take part in both conditions. They “repeat” their participation
- Independent groups
Pilot Studies:
- A small scale version of an investigation that takes place before the real investigation is conducted.
- Aim is to check all materials, procedures and measuring scales are working correctly.
- A small scale version of an investigation that takes place before the real investigation is conducted.
Types of experiments:
- Quasi
- Not really an experiment
- Quasi IVs:
- IV is not manipulated by the experimenter because it related to a pre-existing characteristic of the participants. E.g. Eye colour
- Quasi IVs:
- Not really an experiment
- Lab
- In controlled environment with artificial task
- Field
- Natural environment
- Natural
- Natural setting and task
- Natural IVs:
- IV is not manipulated by the experimenter because it relates to an experience that the participants have/have not had. E.g. how many times they've been on holiday
- Natural IVs:
- Natural setting and task
- Quasi
Demand Characteristics:
- Any cue from the researcher or from the research situation that may be interpreted by participants as revealing the purpose of the investigation. This may lead to a participant changing their behaviour within the research situation.
Investigator effects:
- Any effect of the investigators behaviour (conscious or unconscious) on the research outcome (the DV). Can be anything to do with the study.
- Randomisation:
- The use of chance in order to control for the effects of bias when designing materials and deciding the order of conditions (CONTROLS FOR INVESTIGATOR EFFECTS)
- Randomisation:
- Random Allocation:
- An attempt to control for participant variables in an independent groups design which ensures that each participant has the same chance of being in one condition as any other.
- Standardisation:
- Using exactly the same formalised procedures and instructions for all participants in a research study (CONTROLS FOR DEMAND CHARACTERISTICS), controls bias also
- Standardisation:
- Counterbalancing:
- An attempt to control for the effect of order in a repeated measures design: half the participants experience the conditions in one order, and the other half in the opposite order. When ongroup does the tasks in one order and the opposite group do it in a different order
- An attempt to control for participant variables in an independent groups design which ensures that each participant has the same chance of being in one condition as any other.
- Any effect of the investigators behaviour (conscious or unconscious) on the research outcome (the DV). Can be anything to do with the study.
Types of data
- Primary Data:
- gathered directly/first-hand from the participants, and is specific to the aim of the study
- Evaluation: collects authentic information about participants, strength because data collected would relate directly to the purpose/ aim of the investigation which would increase validity of collecting primary than secondary data.
- Time consuming, takes time away from actual experiment, reduces reliability of results. Also makes it harder to obtain data from a large sample size.
- Evaluation: collects authentic information about participants, strength because data collected would relate directly to the purpose/ aim of the investigation which would increase validity of collecting primary than secondary data.
- gathered directly/first-hand from the participants, and is specific to the aim of the study
- Secondary Data:
- has previously been collected by a third party (another researcher or an official body), not specifically for the aim of the study, and then used by the researcher.
- Evaluation: cost and time efficient, takes less time to get hold of data, creating more time for the actual experiment, allows analysis and discussion of research
- Limitation, lots of variation in research as studies use different sample sizes, makes it difficult to draw a conclusion, limiting the reliability of the resource.
- Evaluation: cost and time efficient, takes less time to get hold of data, creating more time for the actual experiment, allows analysis and discussion of research
- has previously been collected by a third party (another researcher or an official body), not specifically for the aim of the study, and then used by the researcher.
- Meta-analysis:
- process of combining the results from a number of studies on a particular topic to provide an overall view. This may involve a qualitative review of conclusions and / or quantitative analysis of the results.
- Prone to publication bias. Because researcher may only choose to include relevant information, means research is bias
- process of combining the results from a number of studies on a particular topic to provide an overall view. This may involve a qualitative review of conclusions and / or quantitative analysis of the results.
- Qualititative Data:
- expressed in words, e.g. diary extract
- Evaluation: Rich, in depth explanation of research due to the data being expressed words. strength because it allows researcher to gain full insight into participants opinions
- Difficult to analyse, because data is not displayed statistically so it is difficult to draw a conclusion, means researcher has to create a final answer/conclusion, meaning data could now be biased. This hard to generalise.
- Evaluation: Rich, in depth explanation of research due to the data being expressed words. strength because it allows researcher to gain full insight into participants opinions
- expressed in words, e.g. diary extract
- Quantitative data:
- Expressed in numbers,
- Evaluation: Easy to analyse, requires little interpretation, increases objectivity and internal validity
- Limitation, does not express detailed data, less explanation meaning data is less detailed, limiting the validity externally.
- Evaluation: Easy to analyse, requires little interpretation, increases objectivity and internal validity
- Expressed in numbers,
- Primary Data:
Level of measurement:
- Nominal data:
- Data is represented in the form of categories. Example – Above MTG, On MTG, Below MTG
- Ordinal:
- Data can be ranked or ordered in some way. It does not have equal interval between the numbers. Can often be represented on a scale of 1-10 and may involve some interpretation.
- Interval:
- Data is based on numerical scales with equal intervals. The use accepted units of measure and so are more objective than ordinal data.
- Nominal data:
Information
- Description
- A level Psychology Mind Map on Research Methods, created by Katie Jones on 12/01/2019.
- Created by
- Katie Jones
- Views
- 0
- Rating