
Mind map
Methods for Measuring Ligand Binding
Map content
Methods for Measuring Ligand Binding
Isothermal Titration Calorimetry (ITC)
- Differential Scanning Calorimetry (DSC)
- finds the denaturation temperature and how much energy it takes to unfold a molecule
- Proteins unfolding is usually cooperative, meaning when it goes it all goes at once
- When its only one peak and its sharp, cooperative
- Proteins unfolding is usually cooperative, meaning when it goes it all goes at once
- Temperature is gradually increased (~1℃/min) by supplying electrical energy to heaters, in such a way so Tref=Tsample
- What is recorded: the difference in energy required to heat the sample to keep the same temperature as the reference
- can be used to compare thermal stability of different proteins
- finds the denaturation temperature and how much energy it takes to unfold a molecule
- Used for investigating thermodynamics of ligand binding
- Experimental arrangement:
- 1) Ligand is added to sample a few microliters at a time, at ~1 minute intervals (titrations) → releases heat
- 2) Electrical energy is used to keep sample and reference at same temperature (re-equilibrate the sample)
- 1) Ligand is added to sample a few microliters at a time, at ~1 minute intervals (titrations) → releases heat
- The ITC trace is used to find: n, ^H, and Keq (and Kd)
- ^G can be calculated from Keq
- S can be calculated using ^H and ^G
- ^G can be calculated from Keq
- Gives you all thermodynamic parameters
- *A very small amount of heat is released in each ligand binding event, so a large amount of sample must be used so there is enough heat released to be detectable*
- Differential Scanning Calorimetry (DSC)
Surface Plasmon Resonance (SPR)
- What happens to light at the interface of 2 transparent materials with different index of refraction: it gets refracted
- At low angle of incidence, there is “total internal reflection”
- There is an angle of incidence where the energy of the refracted ray can be directed along the interface.
- At the SPR angle, energy can be transferred to electrons in the gold film, creating an excited group of electrons called a “plasmon”
- If the angle of incident light is adjusted just right so that the refracted ray is almost parallel to the gold film, the gold atoms in the film will absorb energy from the refracted light ray and some of the electrons in the gold atoms will become excited.
- When the excited electrons in the gold atoms become mobile it's called a plasmon
- At the SPR angle, there is a decrease in the intensity of the reflected light, due to the transfer of energy to the plasmon
- The SPR angle depends on the index of refraction at the gold surface, which depends on the protein and ligand concentration at the interface
- If the angle of incident light is adjusted just right so that the refracted ray is almost parallel to the gold film, the gold atoms in the film will absorb energy from the refracted light ray and some of the electrons in the gold atoms will become excited.
- At the SPR angle, energy can be transferred to electrons in the gold film, creating an excited group of electrons called a “plasmon”
- There is an angle of incidence where the energy of the refracted ray can be directed along the interface.
- At low angle of incidence, there is “total internal reflection”
- Detector measures the intensity of the reflected light
- If protein #1 binds to protein #2, there will be an “SPR response”
- “SPR response” means a change in the SPR angle, described in response units (RU)
- If protein #1 binds to protein #2, there will be an “SPR response”
- For SPR to be useful in measuring protein-protein (or protein-ligand) interactions, it is necessary to attach a target molecule to the gold surface
- Histidine-tagged proteins can be attached to the surface using their ability to bind to metals with 2+ charge
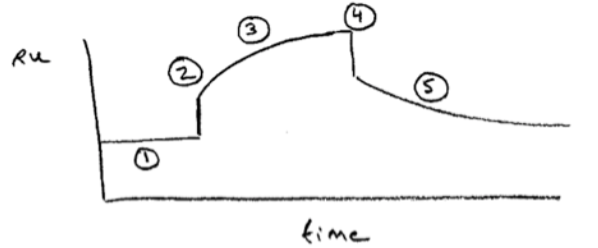
- Procedure:
- 1. Analyte region contains buffer only. Protein #1 is attached to surface
- 2. Introduce protein #2 into solution
- 3. Binding kinetics → kon
- 4. Wash away protein #2
- 5. Dissociation kinetics → koff
- ratio of Koff to Kon is Kd
- 5. Dissociation kinetics → koff
- 4. Wash away protein #2
- 3. Binding kinetics → kon
- 2. Introduce protein #2 into solution
- 1. Analyte region contains buffer only. Protein #1 is attached to surface
- Results:
- SPR data obtained at a range of temperatures can be used to find H and S for ligand binding, using a van’t Hoff analysis
- SPR can measure much smaller values of Kd than ITC
- SPR also uses much less material than ITC
- SPR can measure much smaller values of Kd than ITC
- SPR data obtained at a range of temperatures can be used to find H and S for ligand binding, using a van’t Hoff analysis
- What happens to light at the interface of 2 transparent materials with different index of refraction: it gets refracted
Differential Scanning Fluorescence (DSF)
- Use a dye (SYPRO) that increases its fluorescence in the presence of unfolded protein
- Ligand binding often stabilizes protein structure
- An increase in denaturation temperature indicates that a protein has bound a ligand
- Ligand binding often stabilizes protein structure
- A way to detect the denaturation temperature of proteins
- qualitatively detects ligand binding
- typically used in quickly screening a large number of ligands for binding to a protein
- Use a dye (SYPRO) that increases its fluorescence in the presence of unfolded protein
Equilibrium Dialysis
- Porous membrane lets ligand pass through, and keeps M inside
- Assumptions in equilibrium dialysis:
- All binding sites have equal affinity for ligands
- Binding of ligands is reversible
- kd can be calculated from the concentration of [L] and [M] on either side of the membrane
Fluorescence Anisotropy
- Measuring Fluorescence Anisotropy
- Measure the fluorescence emission with a polarizing filter orientated parallel (and then perpendicular) to the polarization direction of the excitation light
- Anisotropy = 0 when fluorescent light is not polarized
- Anisotropy 0 when fluorescent light is at least partially polarized
- The fluorescence emission of a ligand becomes more polarized when bound to a protein
- Measure the fluorescence emission with a polarizing filter orientated parallel (and then perpendicular) to the polarization direction of the excitation light
- Fluorescence anisotropy is better at detecting binding of a small fluorescent ligand to a large protein
- If a fluorophore does NOT rotate during its fluorescent lifetime, the emitted light will be polarized
- If the fluorophore rotates during its fluorescent lifetime, the emitted light will be mostly depolarized
- Measuring Fluorescence Anisotropy
Images and files in the map
Information
- Description
- Biology Mind Map on Methods for Measuring Ligand Binding, created by Eva Stettler on 12/05/2022.
- Created by
- Eva Stettler
- Views
- 0
- Rating