
Intro to Ecology
Slides in this set (5)
-
- Ecology is the study of the interactions among organisms and their physical environment.
- An organism is a single individual
- A population is a group of interbreeding organisms (group of same species)
- A community is all of the populations of organisms within an area.
- An ecosystem is all of the living and nonliving factors/organisms within an area.
- Biology is the study of life
- Biotic - pertaining to life (things that come from a living organism was once a living organism are biotic)
- Abiotic - without/not pertaining to life
- Habitat - the place the organism lives.
- Niche - the role or job an oranism has in it's enviroment. *an organism can have multiple niches!* (An orgsanism specific niche helps to avoid compettion within its ecosystem.)
- Limiting factors - the resources that limits the population of an organism *limiting factors helps keeep ecosystem in balance and regulate population growth.* (Limiting factors = Limiting resources)
-
- The independent variable goes on the x-axis and the dependent variable goes on the y-axis.
- DEPENDENT
- RESPONDING
- Y-AXIS
- MANIPULATED
- INDEPENDENT
- X-AXIS
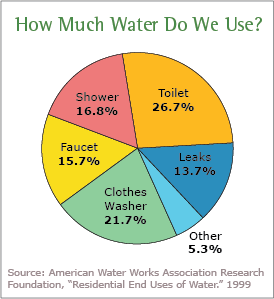
- Caption: A pie chart shows parts of a whole or percentage.
-
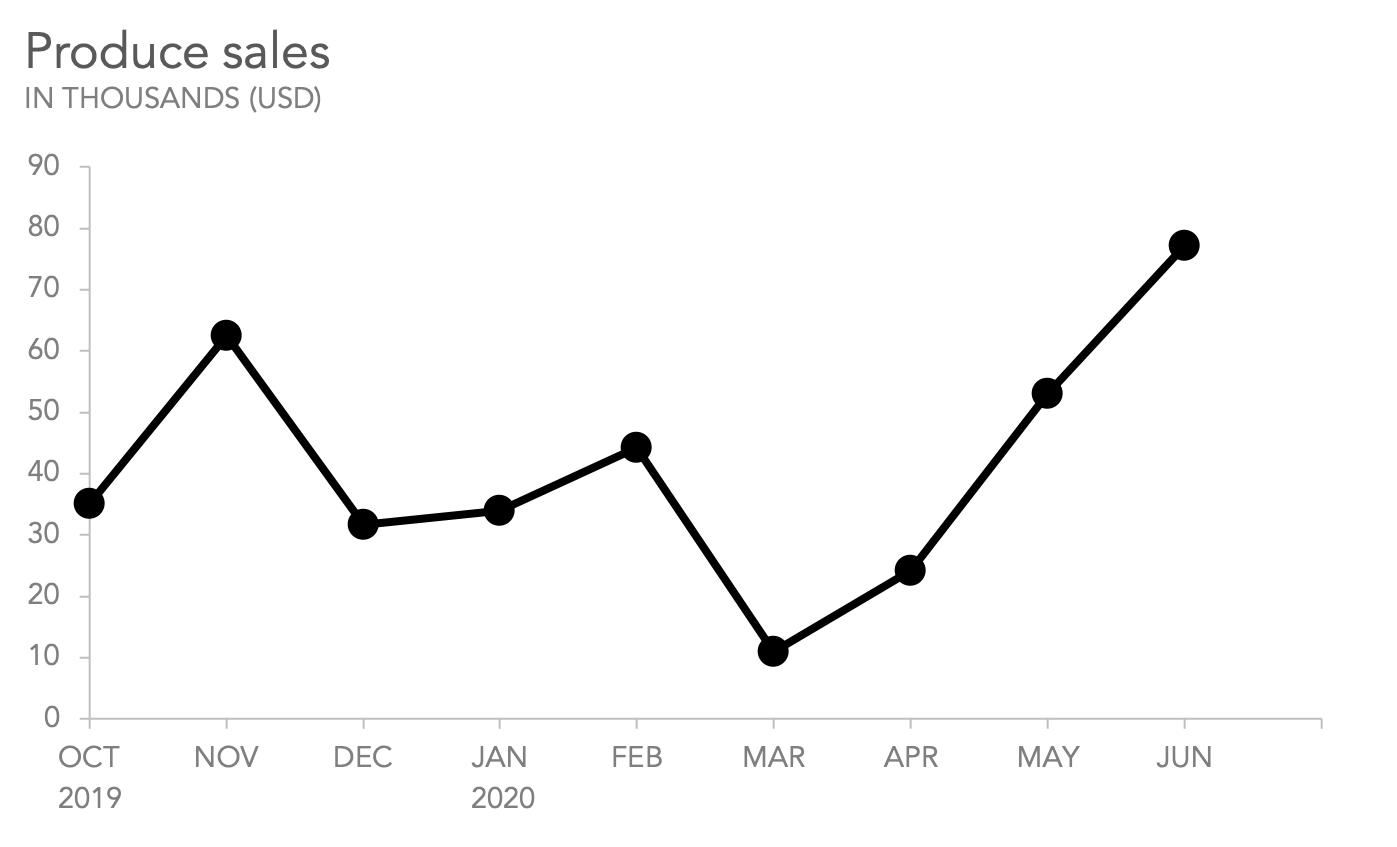
- Caption: A Line graph shows changes over time
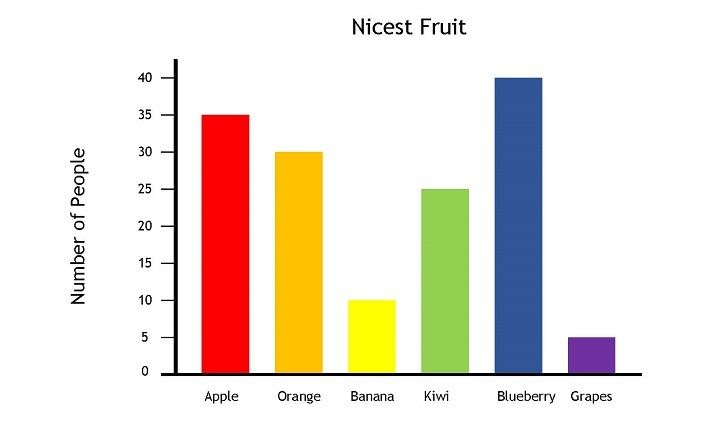
- Caption: A bar graph displays numbers or amounts
-
Population Growth: Exponential Growth
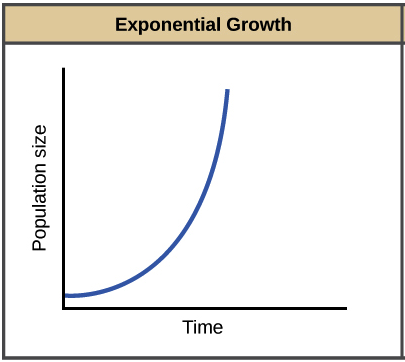
- Caption: A J-curve showin in the graph .
- J - shaped curves on a graph reflect an ecosystem with ideal conditions with unlimited resources.
-
Population Growth: Logistic gowth
- An S - shaped curve on a graph reflects growth that is limited by resources. Carrying capacity is the maximum population size an ecosystem can carry/support.
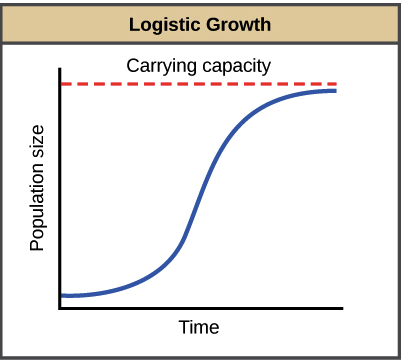
- Caption: An S - curve is shown in the graph.
Information
- Description
- Ecology vocab, graphs, and J & S shaped curves.
- Created by
- Fatmata Musa (Student)
- Views
- 2
- Rating