
Mind map
*Reserch & Analysis
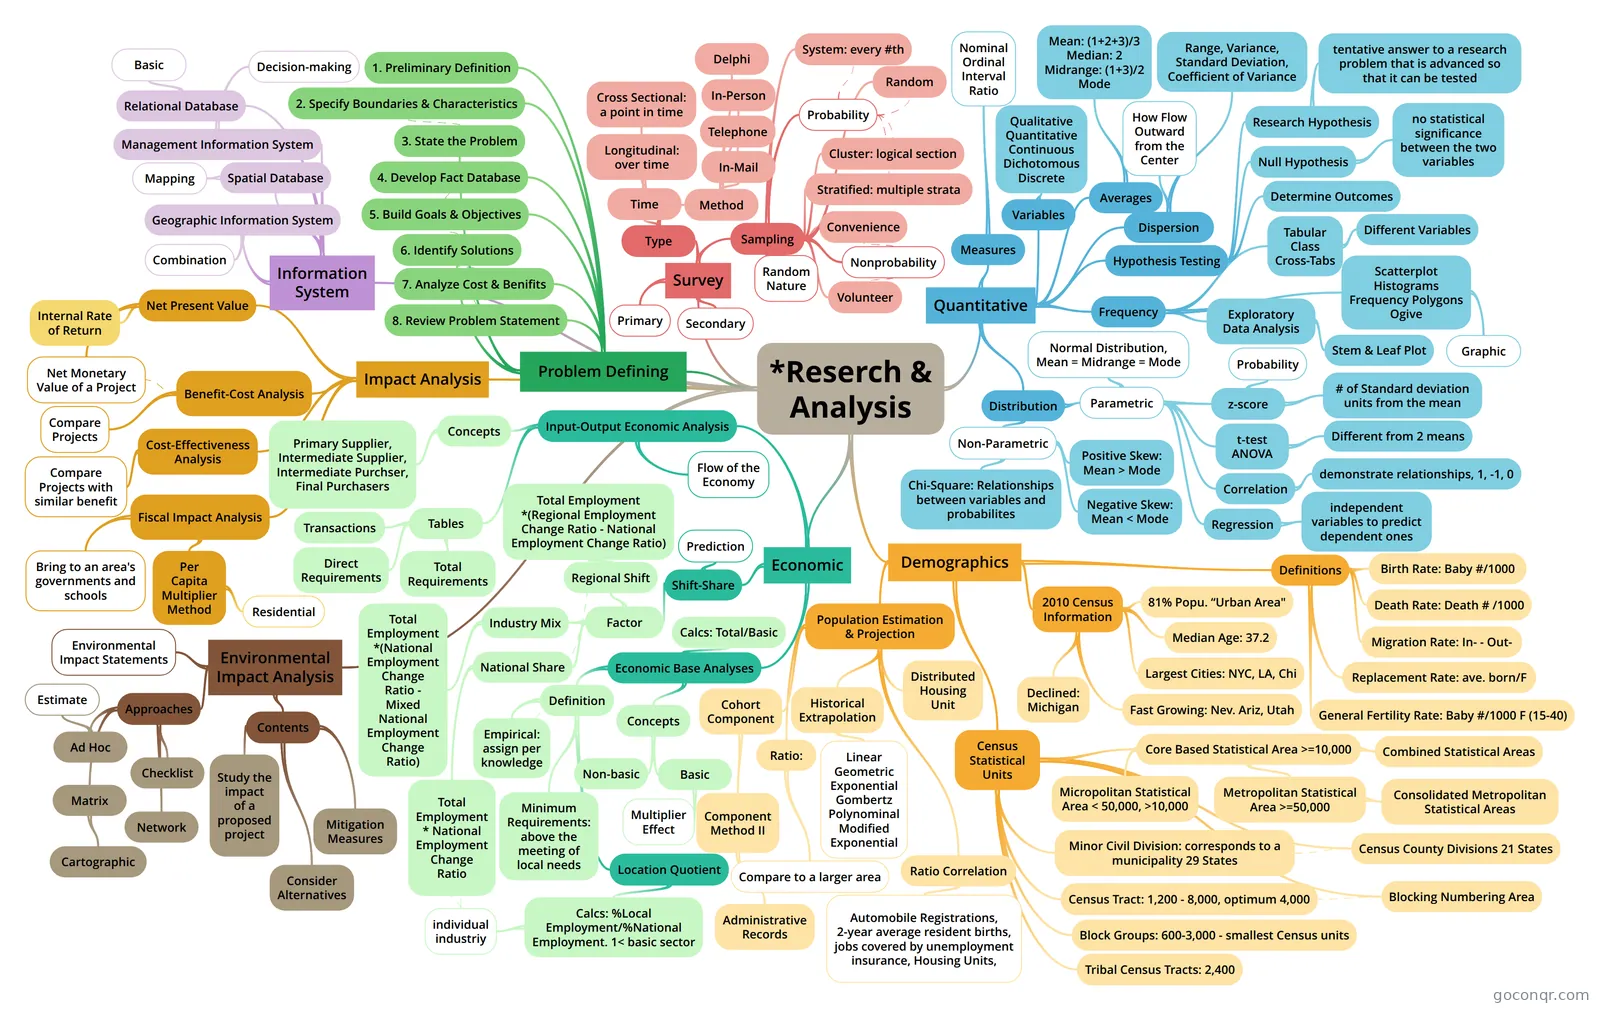
Mind map: Research & Analysis
Map content
*Reserch & Analysis
Problem Defining
- 1. Preliminary Definition
- 2. Specify Boundaries & Characteristics
- 3. State the Problem
- 4. Develop Fact Database
- 5. Build Goals & Objectives
- 6. Identify Solutions
- 7. Analyze Cost & Benifits
- 8. Review Problem Statement
Survey
- Type
- Time
- Cross Sectional: a point in time
- Longitudinal: over time
- Method
- In-Mail
- Telephone
- In-Person
- Delphi
- Time
- Sampling
- Random Nature
- Random
- System: every #th
- Stratified: multiple strata
- Cluster: logical section
- Convenience
- Volunteer
- Nonprobability
- Probability
- Primary
- Secondary
- Type
Demographics
- Definitions
- Birth Rate: Baby #/1000
- Death Rate: Death # /1000
- Migration Rate: In- - Out-
- General Fertility Rate: Baby #/1000 F (15-40)
- Replacement Rate: ave. born/F
- 2010 Census Information
- 81% Popu. “Urban Area"
- Median Age: 37.2
- Largest Cities: NYC, LA, Chi
- Fast Growing: Nev. Ariz, Utah
- Declined: Michigan
- Census Statistical Units
- Core Based Statistical Area >=10,000
- Metropolitan Statistical Area >=50,000
- Consolidated Metropolitan Statistical Areas
- Micropolitan Statistical Area < 50,000, >10,000
- Combined Statistical Areas
- Metropolitan Statistical Area >=50,000
- Minor Civil Division: corresponds to a municipality 29 States
- Census County Divisions 21 States
- Census Tract: 1,200 - 8,000, optimum 4,000
- Blocking Numbering Area
- Block Groups: 600-3,000 - smallest Census units
- Tribal Census Tracts: 2,400
- Core Based Statistical Area >=10,000
- Population Estimation & Projection
- Historical Extrapolation
- Linear Geometric Exponential Gombertz Polynominal Modified Exponential
- Cohort Component
- Component Method II
- Administrative Records
- Component Method II
- Ratio:
- Compare to a larger area
- Distributed Housing Unit
- Ratio Correlation
- Automobile Registrations, 2-year average resident births, jobs covered by unemployment insurance, Housing Units,
- Historical Extrapolation
- Definitions
Economic
- Economic Base Analyses
- Concepts
- Basic
- Multiplier Effect
- Non-basic
- Basic
- Calcs: Total/Basic
- Definition
- Location Quotient
- Calcs: %Local Employment/%National Employment. 1< basic sector
- individual industriy
- Calcs: %Local Employment/%National Employment. 1< basic sector
- Empirical: assign per knowledge
- Minimum Requirements: above the meeting of local needs
- Location Quotient
- Concepts
- Input-Output Economic Analysis
- Flow of the Economy
- Concepts
- Primary Supplier, Intermediate Supplier, Intermediate Purchser, Final Purchasers
- Tables
- Transactions
- Direct Requirements
- Total Requirements
- Shift-Share
- Factor
- National Share
- Total Employment * National Employment Change Ratio
- Industry Mix
- Total Employment *(National Employment Change Ratio - Mixed National Employment Change Ratio)
- Regional Shift
- Total Employment *(Regional Employment Change Ratio - National Employment Change Ratio)
- National Share
- Prediction
- Factor
- Economic Base Analyses
Information System
- Relational Database
- Basic
- Management Information System
- Decision-making
- Spatial Database
- Mapping
- Geographic Information System
- Combination
- Relational Database
Impact Analysis
- Net Present Value
- Net Monetary Value of a Project
- Internal Rate of Return
- Benefit-Cost Analysis
- Compare Projects
- Cost-Effectiveness Analysis
- Compare Projects with similar benefit
- Fiscal Impact Analysis
- Bring to an area's governments and schools
- Per Capita Multiplier Method
- Residential
- Net Present Value
Quantitative
- Measures
- Nominal Ordinal Interval Ratio
- Variables
- Qualitative Quantitative Continuous Dichotomous Discrete
- Averages
- Mean: (1+2+3)/3 Median: 2 Midrange: (1+3)/2 Mode
- Dispersion
- How Flow Outward from the Center
- Range, Variance, Standard Deviation, Coefficient of Variance
- Hypothesis Testing
- Determine Outcomes
- Research Hypothesis
- tentative answer to a research problem that is advanced so that it can be tested
- Null Hypothesis
- no statistical significance between the two variables
- Frequency
- Tabular Class Cross-Tabs
- Different Variables
- Scatterplot Histograms Frequency Polygons Ogive
- Graphic
- Exploratory Data Analysis
- Stem & Leaf Plot
- Tabular Class Cross-Tabs
- Distribution
- Parametric
- Normal Distribution, Mean = Midrange = Mode
- z-score
- # of Standard deviation units from the mean
- Probability
- t-test ANOVA
- Different from 2 means
- Correlation
- demonstrate relationships, 1, -1, 0
- Regression
- independent variables to predict dependent ones
- Non-Parametric
- Positive Skew: Mean > Mode
- Negative Skew: Mean < Mode
- Chi-Square: Relationships between variables and probabilites
- Parametric
- Measures
Environmental Impact Analysis
- Approaches
- Ad Hoc
- Estimate
- Checklist
- Matrix
- Cartographic
- Network
- Ad Hoc
- Contents
- Study the impact of a proposed project
- Consider Alternatives
- Mitigation Measures
- Environmental Impact Statements
- Approaches
Information
- Description
- Planning Planning Mind Map on *Reserch & Analysis, created by Mengting Liu on 27/10/2019.
- Created by
- Mengting Liu
- Views
- 0
- Rating