
Mind map
Correlation (r)
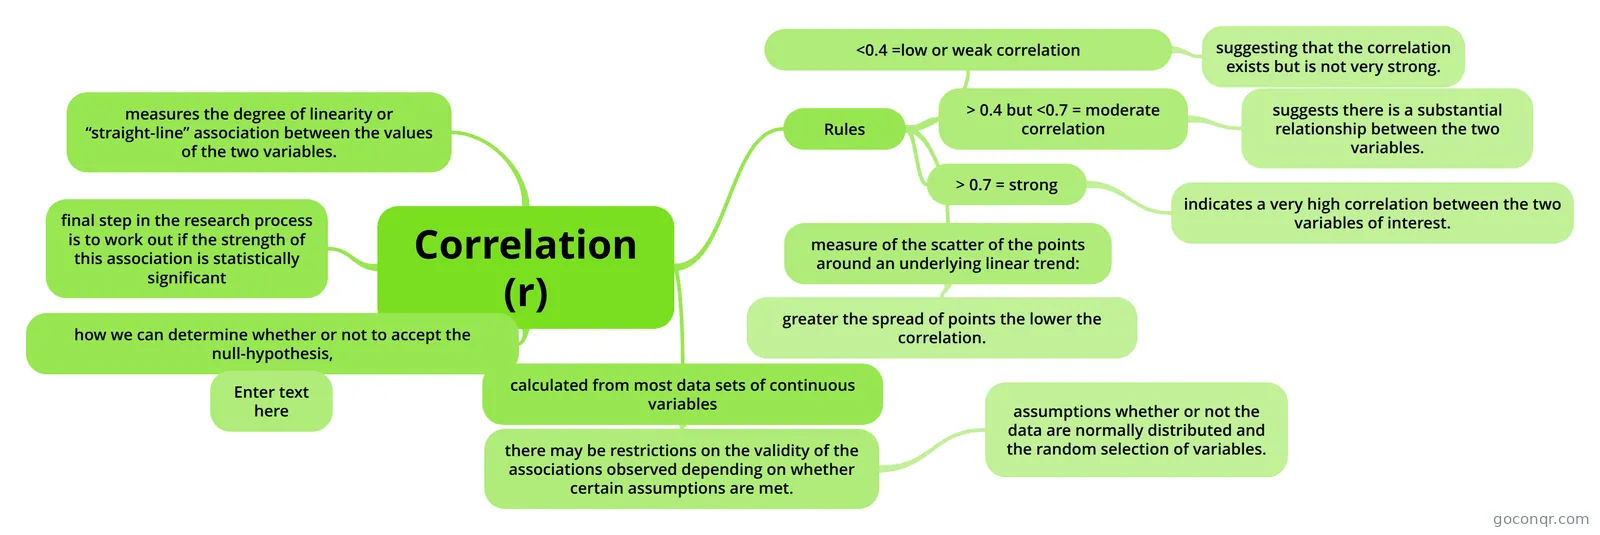
Mind map: Correlation (r)
Map content
Correlation (r)
measures the degree of linearity or “straight-line” association between the values of the two variables.
Rules
- <0.4 =low or weak correlation
- suggesting that the correlation exists but is not very strong.
- > 0.4 but <0.7 = moderate correlation
- suggests there is a substantial relationship between the two variables.
- > 0.7 = strong
- indicates a very high correlation between the two variables of interest.
- measure of the scatter of the points around an underlying linear trend:
- greater the spread of points the lower the correlation.
- <0.4 =low or weak correlation
calculated from most data sets of continuous variables
- there may be restrictions on the validity of the associations observed depending on whether certain assumptions are met.
- assumptions whether or not the data are normally distributed and the random selection of variables.
- there may be restrictions on the validity of the associations observed depending on whether certain assumptions are met.
final step in the research process is to work out if the strength of this association is statistically significant
how we can determine whether or not to accept the null-hypothesis,
- Enter text here
Information
- Description
- HBS108 (Measures of Association) Mind Map on Correlation (r), created by shirley.ha on 10/09/2013.
- Created by
- shirley.ha
- Views
- 69
- Tags
- Rating