
Mind map
Break even
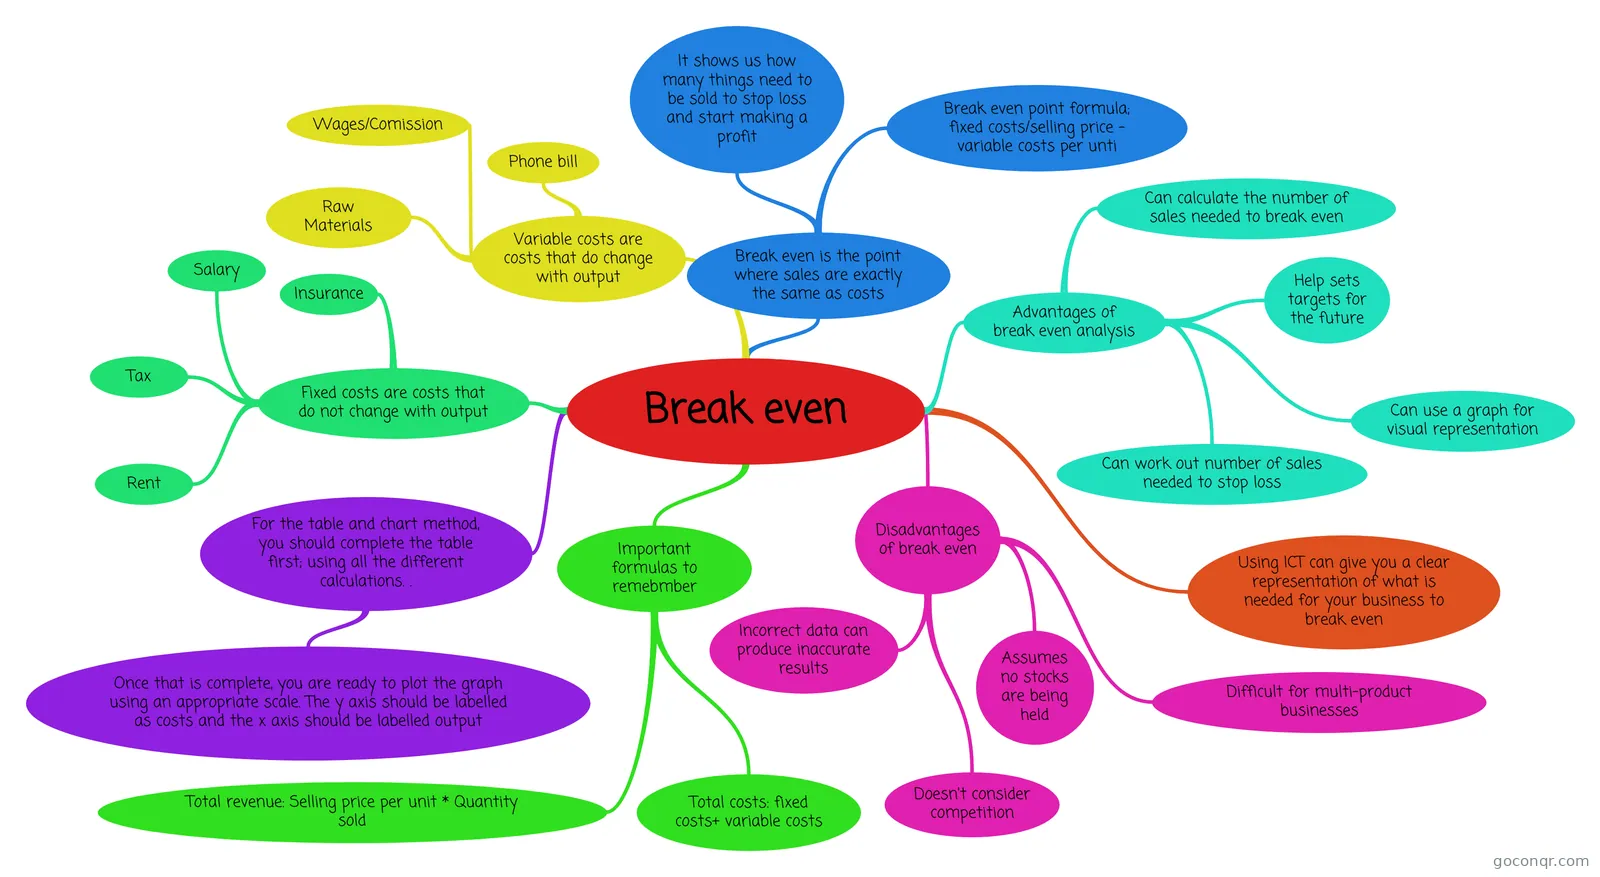
Mind map: break even
Map content
Break even
Fixed costs are costs that do not change with output
- Rent
- Salary
- Insurance
- Tax
Variable costs are costs that do change with output
- Raw Materials
- Phone bill
- Wages/Comission
Break even is the point where sales are exactly the same as costs
- It shows us how many things need to be sold to stop loss and start making a profit
- Break even point formula; fixed costs/selling price - variable costs per unti
For the table and chart method, you should complete the table first; using all the different calculations. .
- Once that is complete, you are ready to plot the graph using an appropriate scale. The y axis should be labelled as costs and the x axis should be labelled output
Important formulas to remebmber
- Total revenue: Selling price per unit * Quantity sold
- Total costs: fixed costs+ variable costs
Advantages of break even analysis
- Can calculate the number of sales needed to break even
- Help sets targets for the future
- Can work out number of sales needed to stop loss
- Can use a graph for visual representation
Disadvantages of break even
- Assumes no stocks are being held
- Doesn't consider competition
- Incorrect data can produce inaccurate results
- Difficult for multi-product businesses
Using ICT can give you a clear representation of what is needed for your business to break even
Information
- Description
- GCSE Business Mind Map on Break even, created by virkstyteu on 09/10/2014.
- Created by
- virkstyteu
- Views
- 45
- Rating