
Mind map
Chapter 6
Map content
Chapter 6
Distributions of Data
- Frequency distributions are graphs that represent how often something occurs
- Bar graphs
- Discrete data and columns do not touch
- Intervals are same length and both use the y-axis to represent the # of data values that fall in that interval
- Histograms
- Continuous data and columns do touch
- Frequency distributions
- Uniform distribution: equal frequencies
- Skewed distributions: greatest frequencies is near one end
- Mound shaped distribution: approximately symmetrical about a line passing through the interval or between the intervals with the greatest frequency
- Bimodal distribution: two distinct intervals or groups that contain the greatest frequencies
Using Statistics
- Mean: average value of data set
- Mode: most common value
- Median: the middle value of data arranged in increasing numerical order
- Lower Quartile: Middle of the data that is less than the median
- Lower extreme: The smallest value
- Upper quartile: the middle of the data that is greater than the median
- Upper extreme: the largest value
- Box and Whisker Plot: a visual way of showing the minimum, lower quartile, median, upper quartile, and maximum values
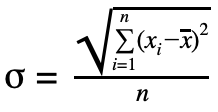
- Standard deviation:a measure of spread
- 1. Find mean
- 2. Subtract each data point from the mean
- 3. Square the difference of the data point and mean
- 4. Find the sum of the squares and then divide by the number of data values, n
- 5. Take the positive square root
- 4. Find the sum of the squares and then divide by the number of data values, n
- 3. Square the difference of the data point and mean
- 2. Subtract each data point from the mean
- 1. Find mean
Normal Distribution:
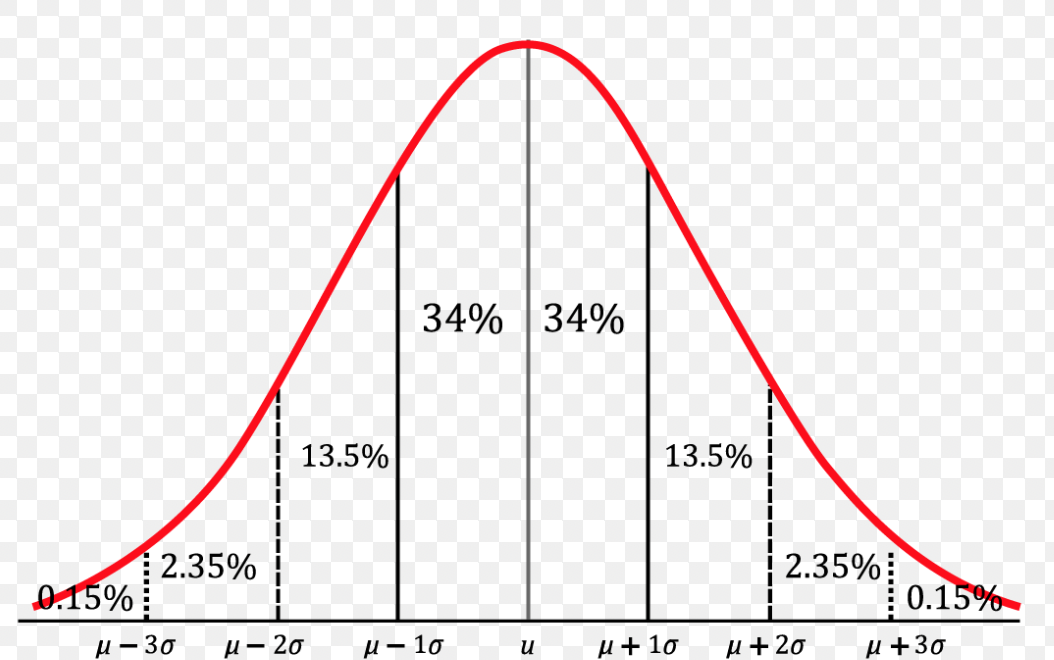
- 68-95-99.7 rule
- About 68% of the data are within one standard deviation of the mean
- About 95% of the data are within two standard deviations of the mean
- About 99.7% of the data are within three standard deviations of the mean
- About 95% of the data are within two standard deviations of the mean
- About 68% of the data are within one standard deviation of the mean
- 68-95-99.7 rule
Fitting liner models to data
- Correlation coefficient
- "r" measures how good of a fit your regression is
- r=1, perfectly straight and positive slope
- r= -1, perfectly straight, negative slope
- r=0, random scattering
- "r" measures how good of a fit your regression is
- Median-median line
- three data points, less influenced by outliers, and y=mx+b format
- uses summary points calculated using medians
- Least-squares method
- uses all data point y=mx+b format
- Correlation coefficient
Standardizing Data
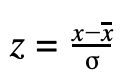
- A Z-score will standardize the data, only for normally distributed data
- Standard normal: A curve that has a mean of 0 and a standard deviation of 0
- Positive: that many SD above the mean
- Negative: that many SD below the mean
- A Z-score will standardize the data, only for normally distributed data
Fitting quadratic models to data
- Quadratic Regression
- Least- squares parabola, can be influenced by outliers
- Matrix Method
- Only uses three points and is not influenced by outliers
- Quadratic Regression
Images and files in the map
Information
- Description
- Mind Map on Chapter 6, created by Joshua Mae on 04/06/2019.
- Created by
- Joshua Mae
- Views
- 4
- Rating