
Descriptive Statistics mind maps
544 mind maps by 474 users · Page 1 of 14
This GoConqr page gathers over 500 mind maps on Descriptive Statistics, covering data types, dispersion and distributions. They can help university students and professional candidates practise summarising data, school students revise statistics, and teachers find material for lessons; the collection includes university- and secondary-level resources. Pick a map to get started.
Mind maps
-
Business Statistics Estadística Comerciales
-
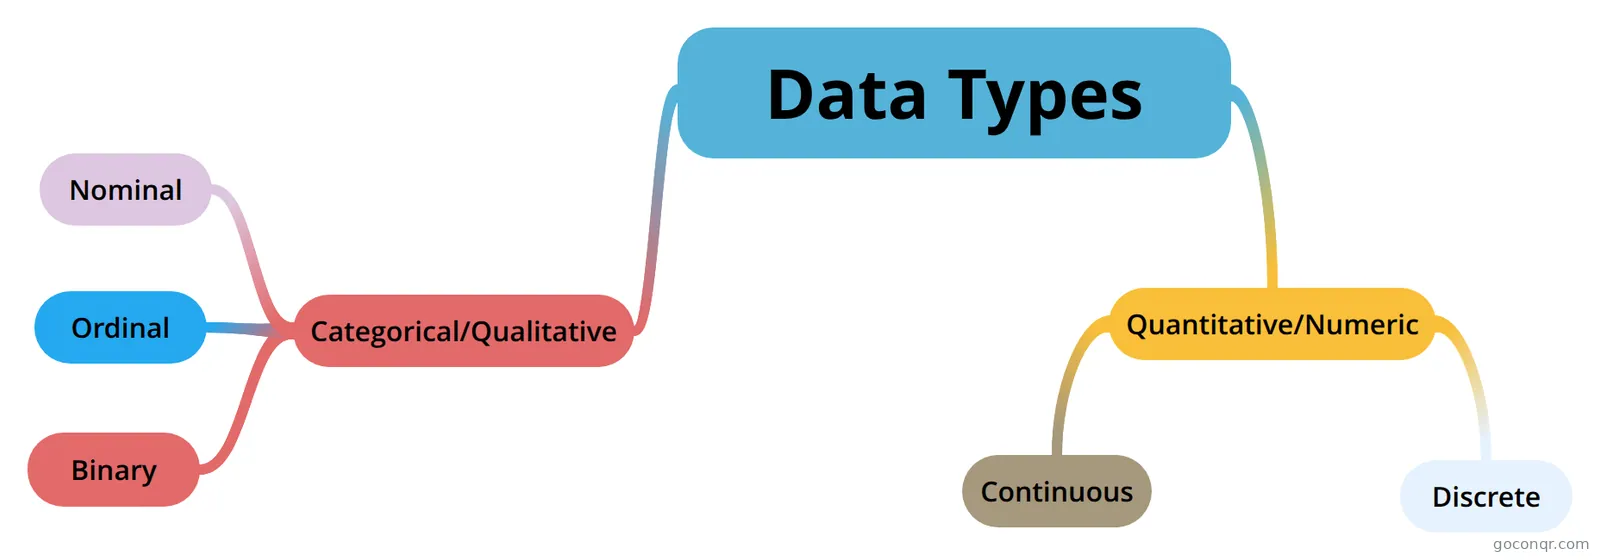 Data Types https://blog.minitab.com/blog/understanding-statistics/understanding-qualitative-quantitative-attribute-dis...
-
Measures of dispersion
-
 Measures of central tendency. Measures of central tendency
-
Measures of dispersion
-
MEASURES OF DISPERSION MAPA MENTAL ESTADISTICA DORA MARIA ROPAIN
-
Business Statistics Bus 214 Peru State
-
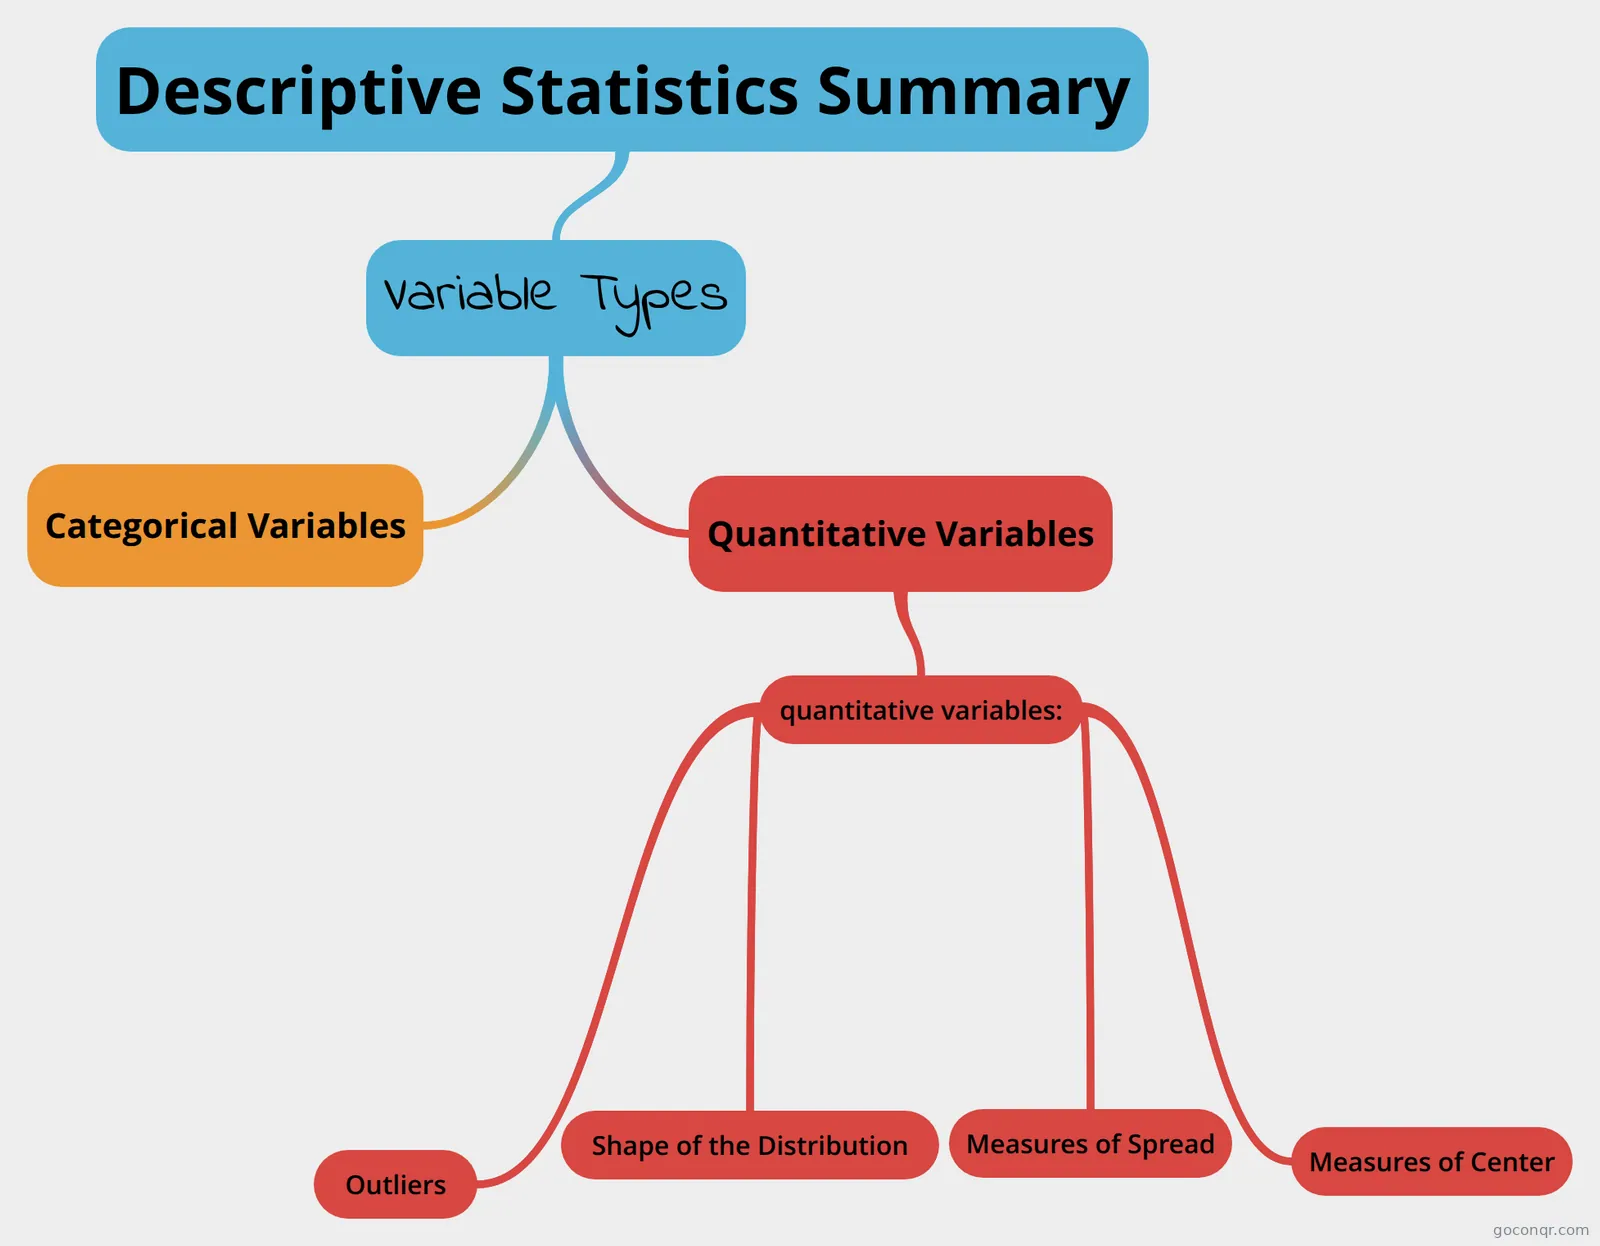 Descriptive Statistics Summary brief description in the statics course
-
Descriptive Statistics
-
STATS
-
Statistics
-
Statistics
-
Statistics of One Variable
-
Information, events and types
-
MEASURES OF DISPERSION
-
Descriptive Statistics
-
Univariate static measures Fase 3 de estadistica descriptiva
-
Statistics
-
STATISTICS CHAPTER 2
-
Position measures
-
Statistics
-
Psych Statistics
-
measures of central tendency
-
What are business statistics?
-
Statics
-
univariate measures-statistics Marina
-
Statistics
-
Measures of Central Tendency
-
Statistics
-
Measures of dispersion
-
UNIVARIATE MEASURES (measures of central tendency)
-
Measures of central tendency & dispersion
-
measure of central tendency
-
Statistics
-
MEASURES OF DISPERSION
-
Measures of central tendency
-
MEASURES OF CORE TREND
-
Stadistics Class resume ;)
-
Statistics
-
position measurements
More Descriptive Statistics resources
About descriptive statistics mind maps
GoConqr OriginalDescriptive Statistics mind maps to explore
Start with Data Types if you want to sort out the distinction between quantitative and categorical data. Its branches also introduce terms such as nominal, ordinal, continuous and discrete. For a wider view, Descriptive Statistics Summary brings variable types, measures of centre and spread, distribution shape and outliers together.
Other maps let you focus on a particular idea. The maps titled Measures of dispersion look at how spread out values are, while Distribution includes skew, shape and z scores. Business Statistics includes a map covering the mean, median and weighted mean.
Revise with a map
Follow the branches of a map, then cover them and try to recall the connections. Return to any branch you found difficult and compare it with another map on the same topic. When you want to check your understanding with questions, switch to a quiz on the unit page. Choose a topic and follow its branches.
Frequently asked questions
Which mind map should I start with?
Start with Data Types if you want to practise distinguishing quantitative and categorical data. For a broader overview, Descriptive Statistics Summary brings together variable types, centre, spread, shape and outliers. You can then move to a map that focuses on the area you want to revisit.
Are these mind maps free to use?
Yes. Every resource listed here is free to open and study without an account. The maps were made by GoConqr users. A free account also lets you make your own mind maps, flashcards, quizzes and notes, and save your quiz scores.
Who are these mind maps for?
The collection includes university- and secondary-level resources. University students and professional candidates can use the maps to revisit topics such as data types and dispersion. School students can use them for statistics revision, while teachers can look for material to support lessons on the same topics.