
Quality Control and Statistical Process Control mind maps
169 mind maps by 145 users · Page 1 of 5
This GoConqr page gathers over 160 quality control and statistical process control mind maps made by more than 140 users, covering quality tools, charts and sampling. They offer university students and professional candidates ways to review these topics, and teachers ready-made material to use. Explore the maps and choose a topic to revisit.
Mind maps
-
DECISION MAKING TOOLS
-
QUALITY TOOLS
-
Quality circles
-
Quality tools
-
Quality Tools
-
Negotiation and Decision Making
-
Types of Diagrams
-
Negotiation and Decision Making
-
Quality gurus
-
QUALITY TOOLS
-
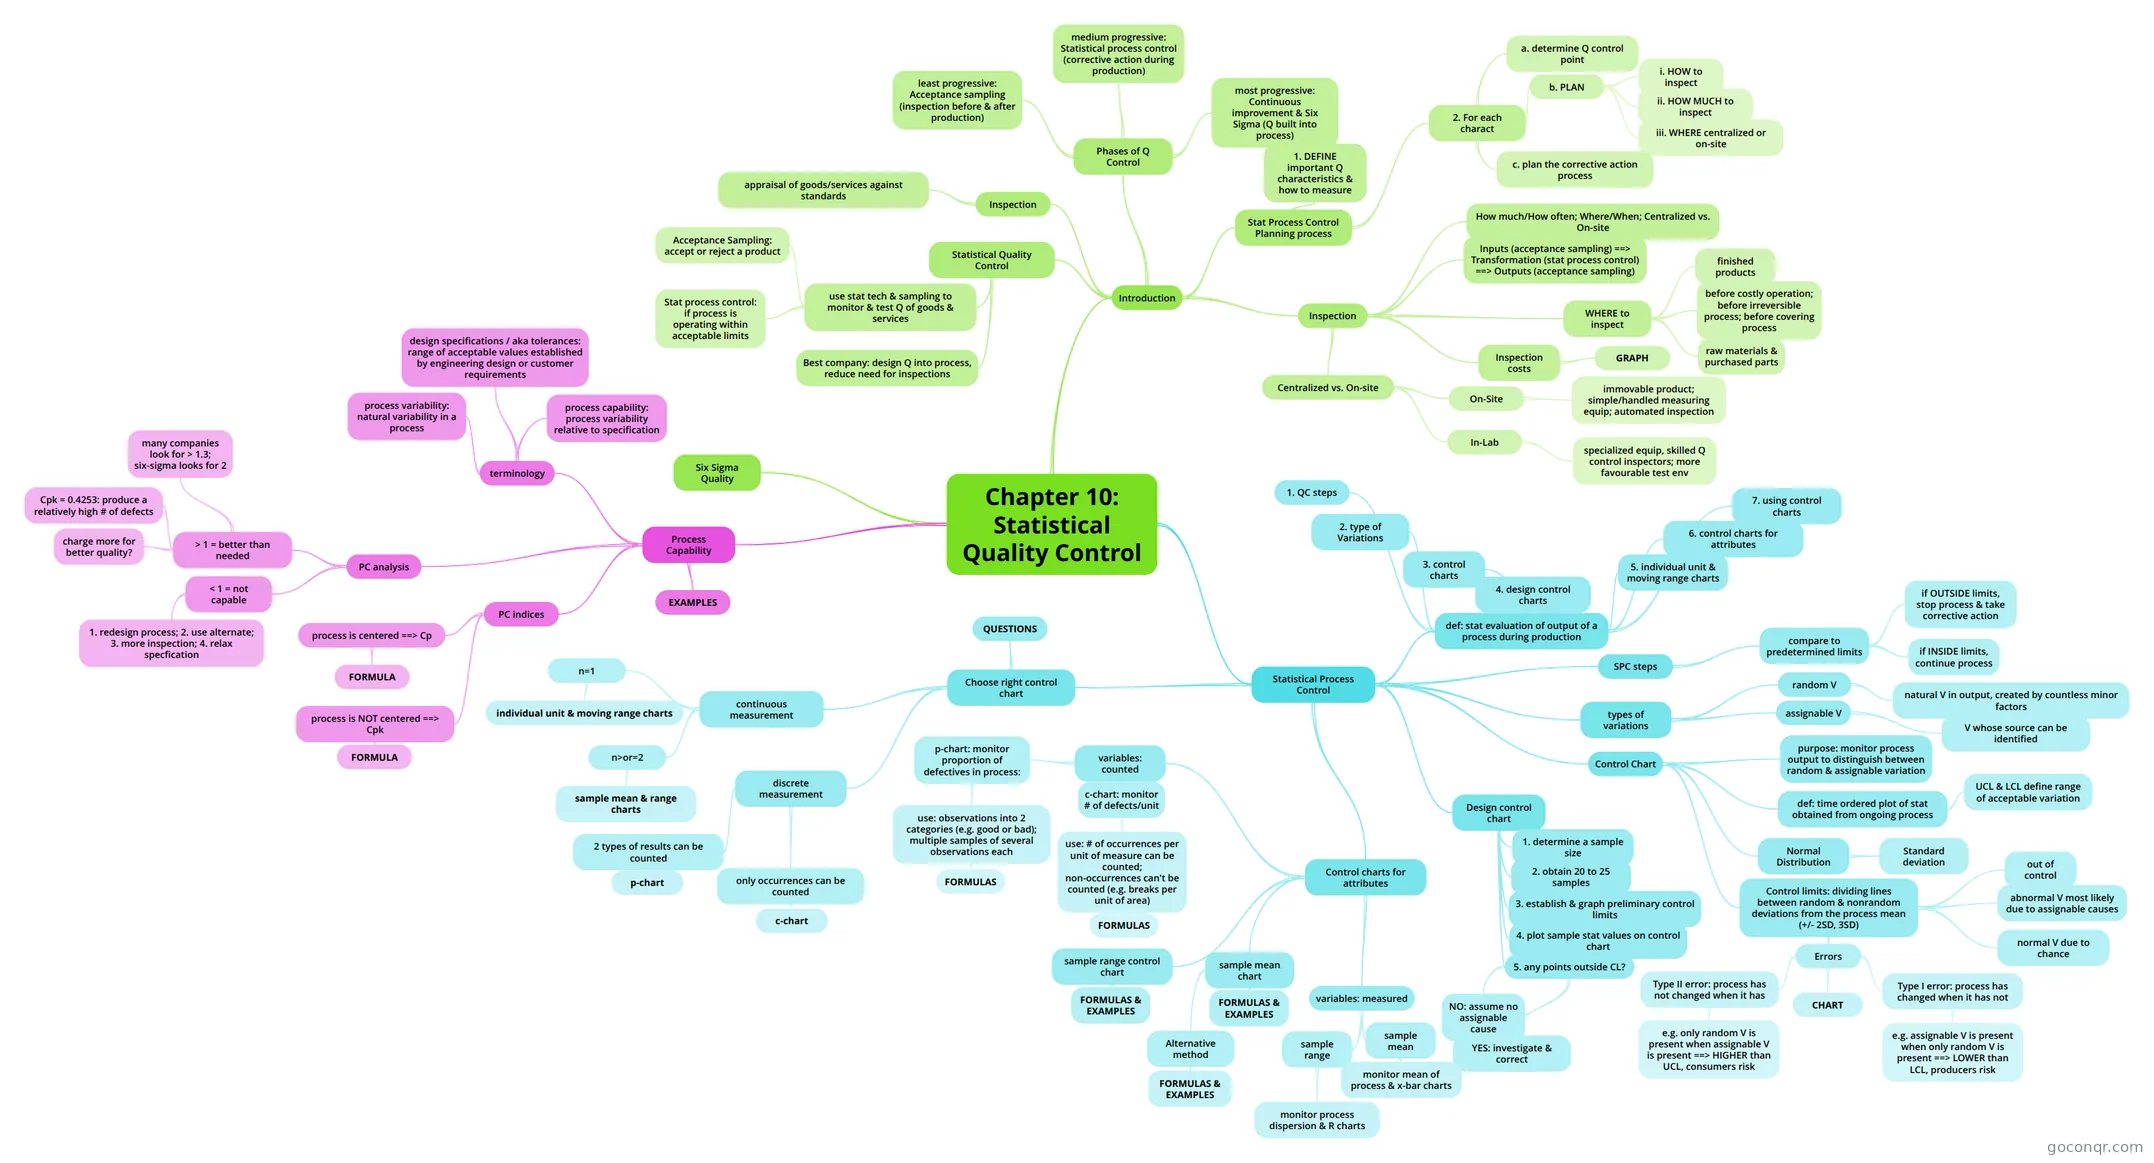 Chapter 10: Statistical Quality Control
-
Quality Tools
-
Acceptance Sampling
-
Basic tools of quality
-
Quality Assurance (QA) and Quality Control (QC)
-
5 PRESENTATIONS
-
Exposition
-
Work smarter, not harder: Guidelines for designing simulation experiments
-
QUALITY TOOLS
-
Seven basic tools of quality control The appropriate techniques for solving quality problems in the organizations
-
POKA YOKE
-
BASIC TOOLS OF QUALITY
-
Decision Making
-
Basic tools of quality
-
Statistics Applied to Quality Control_1
-
Statistics Applied to Quality Control
-
Attribute control chart
-
Negotiation and Decision Making
-
Basic tools of quality
-
Quality Tools
-
Quality Tools
-
5 Whys Analysis
-
Control chart
-
The seven basic tools of quality
-
Fishbone Tool for Root Cause Analysis
-
quality tools
-
Basic tools of quality
-
QUALITY MODELS AND TOOLS
-
statistical quality control
-
Basic tools of quality
More Quality Control and Statistical Process Control resources
About quality control and statistical process control mind maps
GoConqr OriginalUsing quality control and statistical process control mind maps
These maps let you follow branches between related ideas. For a broad starting point, choose the map on statistical quality control that covers process capability and Six Sigma. Then look at Quality Tool Belt to see basic tools alongside management, statistical and measurement tools.
For a closer look at cause and effect diagrams, try Ishikawa's Seven Basic Tools of Quality Control. Its branches connect symptoms, possible causes and root causes. Shewhart Charts takes a different route, setting out chart construction and the conditions in which a chart is built.
Move between formats
As you revise, follow a map's branches and recall how the ideas connect before checking them again. When you want to test your recall, switch to a quality control quiz on the unit page. For acceptance sampling, you can also use the unit's flashcards alongside its mind map.
Pick a map and use its branches to organise your next revision session.
Frequently asked questions
Which mind map is a useful starting point?
The map on statistical quality control is a broad starting point: it includes statistical process control, process capability and Six Sigma quality. If you would rather begin with a collection of tools, try Quality Tool Belt, which groups basic tools with management, statistical and measurement tools.
Which maps cover charts and quality tools?
Shewhart Charts outlines chart construction and conditions for building a chart. Ishikawa's Seven Basic Tools of Quality Control includes cause and effect diagrams, with branches on symptoms, causes and finding a root cause. Quality Tool Belt provides another view, grouping several kinds of quality tool.
Are these mind maps free to use?
Yes. Every resource listed here is free to open and study without an account. The maps were made by GoConqr users, rather than by GoConqr. A free account also lets you save quiz scores and make your own quizzes, mind maps, flashcards and notes.