
Fichas
Chapter 2
Fichas del conjunto (25)
- 1Frequency Distributions(Table)shows how data set is partitioned among all of several categories by listing categories with frequency of data values in each
- 2Relative frequency distributionsame class limits , but frequency of a class is replaced with relative frequencies (proportion or percent)
- 3lower class limitssmallest numbers that can belong to different classes
- 4upper class limitslargest numbers that can belong to different classes
- 5class boundariesvalues that separate classes
- 6class midpointsvalue in middle of a class
(add lower class limit to upper class limit and divide sum by 2) - 7class widthdifference bw 2 consecutive lower(upper) class boundaries
- 8histogramgraph where horizontal scale represents classes of quantitative data values and vertical scale represents the frequencies
- 9RELATIVE FREQUENCY histogramvertical marked with relative frequencies instead of actual
- 10Centerrepresentative value shows where middle of data set is located
- 11Variationmeasure of the amount that the data values vary
- 12Distributionnature or shape of the spread of data over range of values
- 13outlierssample values that lie very far away from vast majority of other sample values
- 14timechanging characteristics of data over time
- 15Bell shape histogramnormal distribution
1. low to high to low frequencies
2.distribution is approx. symmetric - 16uniform distributiondifferent possible values occur with approx the same frequency
- 17Skewed data1.to right (positively skewed) have longer right tail
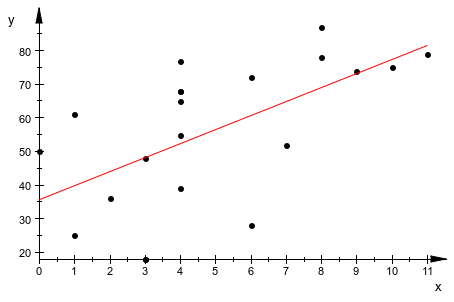
2. to left(negative skewed) have longer left tail - 18Scatter plotused to determine relationship bw 2 variables (bivariate data)
- 19Time series graphdata collected at diff points in time, time on horizontal axis
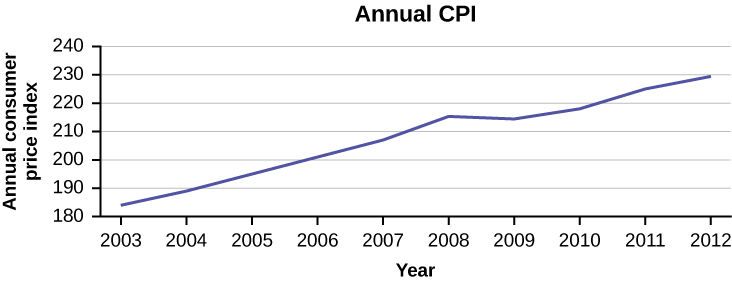
- 20Dotplotdata plotted at a point, dots with equal values are stacked
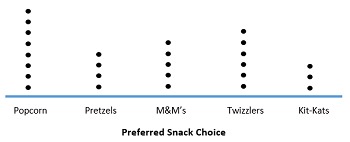
- 21Stem and Leaf PLotLeftmost digit: the stem
rightmost digit: the leaf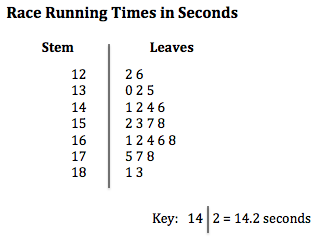
- 22Bar Graphbars show frequencies of categorical, or qualitative data
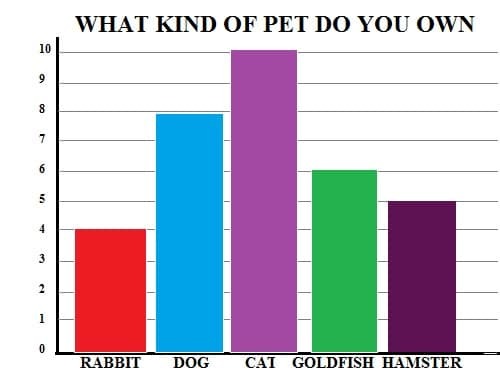
- 23Pie chartqualitative data as slices of a circle, size of slice is proportional to frequency count
*bar chart is better because pie charts don't specify percentages* - 24Nonzero AXis (deceptive)used to exaggerate differences
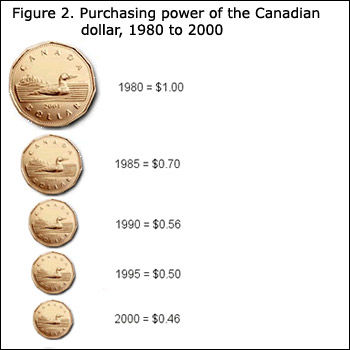
- 25Pictographs (deceptive)3 dimensional objects create false impressions that distort the data
Información
- Descripción
- mostly describes graphs and their proper use
- Creado por
- Kamrin Lazenby
- Visitas
- 4
- Valoración