
Flashcards
PSYCH Ch. 2 Research Methods

Cards in this deck (43)
- 1Hindsight BiasThe tendency to believe, after learning an outcome, that one would have foreseen it.
- 2OverconfidenceWe tend to think we know more than we do.

- 3HypothesisA testable prediction, often implied by a theory.
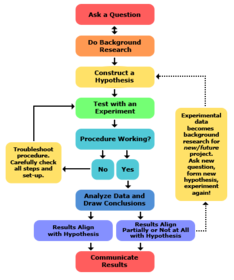
- 4Scientific MethodA systematic, step-by-step procedure psychologists use when conducting research. By following these specific steps, psychologists seek cause and effect relationships which means that they can be certain.
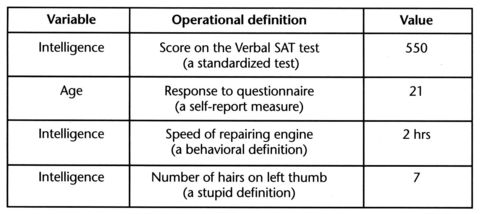
- 5Operational Definition (Operation Definition)Statement of your procedures; identifies the IV and DV, sampling and assignment. For example, human intelligence may be operationally defined as what an intelligence test measures.
- 6Case StudyAn observation technique in which one person is studied in depth in the hope of revealing universal principles. EX: Phineas Gage

- 7SurveyDescriptive method; uses questionaires or interviews.

- 8Naturalistic ObservationObserving and recording behavior in naturally occurring situations without trying to manipulate and control the situation.

- 9CorrelationResearchers observe or measure a relationship between variables.
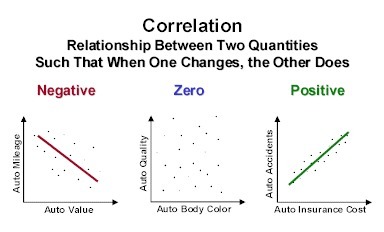
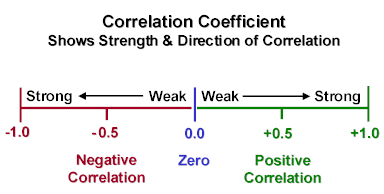
- 10Correlation coefficientA statistical index of the relationship between two things. (From -1 to +1).
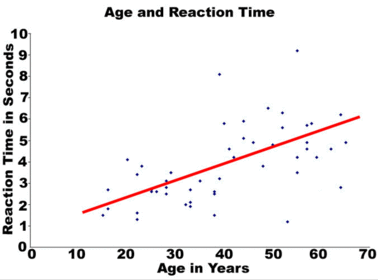
- 11ScatterplotA graphed cluster of dots, each of which represents the values of two variables. The slope of the points suggests the direction of the relationship between the two variables. The amount of the scatter suggests the strength of the correlation (little scatter indicates high correlation).
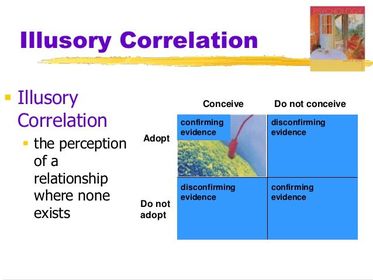
- 12Illusory CorrelationA perception of a relationship where none exists.
- 13Ethical Principles for Animal Research1.) Research must have a clear, scientific purpose.
2.) Provide humane living conditions for animals.
3.) Legally obtain animals.
4.) Least amount of suffering. - 14Standard DeviationShows how far scores vary from the mean (average) score.
- 1568-95-99.7 RuleMeans 68% of all scores fall within one standard deviation of the mean; approx. 95% of all scores fall within two standard deviations of the mean; 99.7% of all scores fall within three standard deviations of the mean.
- 16Normal DistributionForms a bell-shaped or symmetrical curve (upside down u) with mean, mode, and median the same score; 2 sides are mirror images. Represents data about how most human traits are distributed through population. EX: SAT, IQ.
- 17ModeThe most frequently occurring score.
- 18MedianThe middle score; score that divides a frequency distribution exactly in half; so that the same number of scored lie on each side.
- 19MeanThe average; sum of set of scores divided by the number of scores.
- 20Dependent VariableWhat is being measured in an experiment; the research variable that "depends" on the independent variable.
- 21Cross-sectional StudyCompares individuals at various ages at ONE POINT in time. (one and done)
- 22Longitudinal StudyStudies a single individual or a group over an extended period of time. Provide in depth information but can be expensive and time-consuming.
- 23Random AssignmentAssigning participants to experimental and control groups by chance so that every individual has an equal chance of being put in any group or condition. Is not possible for studies dealing with differences between sexes or age groups.
- 24Zero CorrelationIndicates there is NO relationship between 2 variables. EX: hat size and shoe size.
- 25Negative Correlation-1.00 (closest to it); means 2 variables move in opposite directions.
- 26Positive Correlation+1.00 (closest to it); means 2 variables move in the same direction. EX: Positive relationship between smoking and lung cancer.
- 27Participant BiasTendency for research participants to respond in a certain way because they know they are being observed.
- 28Research BiasTendency for researchers to look for evidence that supports their hypothesis and ignore contradictory evidence.
- 29Skewed DistributionDistribution with most scores squeezed to one end, few scores stretch out like tail. Skew named for distribution of tail. Negatively skewed--skewed to left. Positively skewed--skewed to right. Mean pulled n direction of tail away from median; median measures centrality best.
- 30ReliabilityConsistency or repeatability of results. Split halves reliability compares scores on half to other half. Test retest reliability compares scores on the same test taken at different times. interrater reliability compares scores by different scorer of the same test.
- 31Random SelectionChoosing of members of a population so that every individual has an equal chance of being chosen for a sample.
- 32Quasi-ExperimentMeasured of Dv (dependent variable) when random assignment to groups of a randomly selected sample is not possible. Often applies to studies involving sex or age of participants. Can suggest cause and effect.
- 33Quantitative DataInformation can be reported as numbers for ease of handling. Nominal scale uses numbers to name something, can be used to count cases. Ordinal scale can be ranked, ordered. Numbers cannot be average.
- 34PopulationAll of the individuals in the group to which the study applies. A sample is a subgroup of the population that participates in the study.
- 35PlaceboPsychical or psychological treatment given to the control group that resembles the treatment given to the experimental group, but contains no active ingredients. Placebo effect--response to belief that the IV will have an effect, rather than the actual effect of the IV.
- 36Inferential StatiscticsStatistics used to interpret data and draw conclusions. Uses rules to evaluate probability that a correlation or difference between groups reflects a real relationship, not just chance (p) is the measure of real difference, p< 0.5 or p< 0.01 needed.
- 37Experimental GroupGroup that your are experimenting on; receives the independent variable (IV).
- 38ExperimentResearch method that involves manipulation of an independent variable (IV) under controlled conditions and measurement of its effects on a dependent variable (DV). Only method that can establish cause and effect between IV and DV.
- 39Ethical Guidelines for Human Research1.) Informed consent.
2.) Voluntary participation.
3.) Debriefing.
4.) Confidentiality - 40Descriptive StatisticsNumbers that summarize a set of research data from sample. Can be pictured as histogram or frequency polygon.
- 41Confounding VariablesFactors that cause differences between the experimental group and the control group other than the independent variable. EX: Experimenter bias (also called expectancy effect)-- occurs when a researcher's expectations about the outcome of a study influence the results.
- 42Central TendencyDescribes average of a distribution. Median is the middle score when data is ordered size. Mean is arithmetic average of scores. Mde is most frequent score, bimodal distribution has 2 most frequent scores, multimodal distribution has 3 or more.
- 43—
Information
- Description
- AP Psychology Unit 2 Vocab.
- Created by
- victoria russ
- Views
- 1
- Tags
- History
-
- Created by skmitchell · Feb 3, 2016
- Copied by victoria russ · Aug 6, 2018
- Rating