
Flashcards
Descriptive Stats
Cards in this deck (6)
- 1Descriptive StatsMean - Add up all numbers and divide by the number of numbers
Mode - Counting which one occurs the most frequently
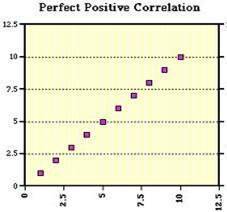
Median - Arranging scores in order and finding the mid point - 2Range The range is the a measure of the spread of a set of scores, shown by the difference between the highest value and the lowest This is the measure of the spread of data around the mean. The higher the value the more variation in your scores.Positive correlation
Variables rise and fall together - 3Negative correlation One variable rises, the other one fallsCorrelation Coefficient
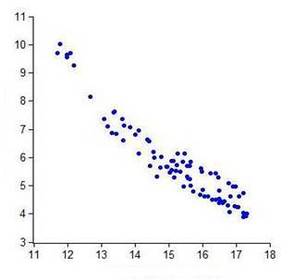
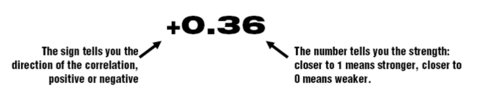
- 4Bar charts are used for non continuous data Histograms are for when you have continuous data Frequency polygons are good for showing more than one set of data Scatter graphs are for correlational dataContent Analysis
A kind of observational study in which behaviour is observed indirectly in written or verbal material - 5Sampling: the researcher must decide which material to use Coding units: The researcher must decide how to categorise the material.Behaviour categories
Quantitative analysis: Examples in each category are counted.
Qualitative analysis: Examples in each category are described rather than counted - 6Strengths High ecological validity because they are based on direct observations When the resources can be retained, findings can be replicated and tested for reliabilityLimitations
Observer bias
Reductionism: it could be argued that converting qualitative data to numbers is reductionist, meaning the richness and complexity of the qualitative data is lost.
Information
- Description
- A Levels Psychology (research methods) Flashcards on Descriptive Stats, created by 08shunt.gemma on 22/01/2015.
- Created by
- 08shunt.gemma
- Views
- 6
- Rating