
Mind map
TENSILE TESTING GRAPHS
Map content
TENSILE TESTING GRAPHS
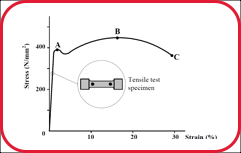
Stress Strain Graphs
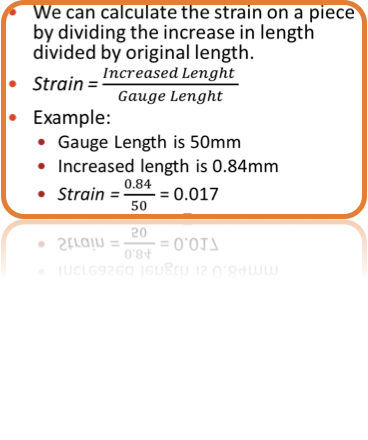
- Strain
- On the X-axis
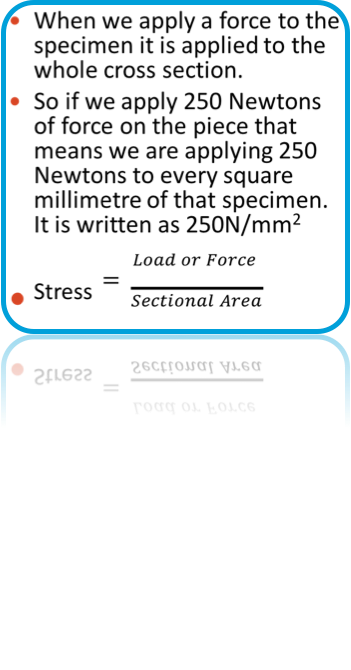
- Stress
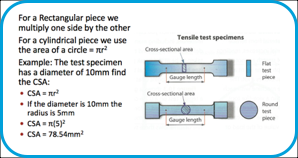
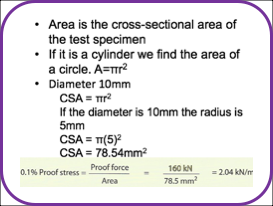
- We must calculate the Sectional Area (CSA)
- 2 types of CSA to find
- CSA of a Rectangle
- CSA of a Circle
- CSA of a Rectangle
- 2 types of CSA to find
- We must calculate the Sectional Area (CSA)
- Strain
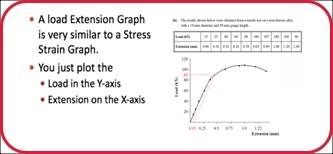
Load Extension Graphs
Key Words
- A YIELD STRENGTH or YIELD POINT is the material property defined as the stress at which a material begins to deform plastically.
- DEFORMATION is when a material is in the process of deforming or distorting.
- PLASTIC DEFORMATION is when a piece of properties have been changed.
- PROPORTIONALLY when thing moves up at an even pace.
- ULTIMATE TENSILE STRENGTH (UTS) is when a piece reaches the most tension it can take before breaking. Anymore tension and it will break.
- FRACTURE to break.
0.1% Proof Stress
- Load Extension
- Stress Strain
- Is to find the Yield Point on the graph when it isnt clear to see
- Load Extension
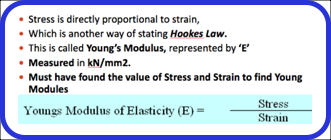
Youngs Modules of Elasticity
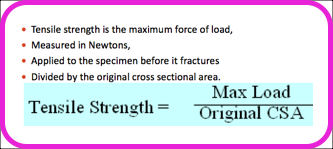
Ultimate Tensile Strength
Images and files in the map


Information
- Description
- Sixth year Engineering Mind Map on TENSILE TESTING GRAPHS, created by Jack Brosnan on 30/09/2018.
- Created by
- Jack Brosnan
- Views
- 0
- Rating
More on Properties and testing of materials