33006250
Description
Mind Map by Alexander Xavier Ansari, updated more than 1 year ago
|
|
Created by Alexander Xavier Ansari
over 2 years ago
|
|
Información de Matemáticas
- Visualizatión
- Gráficos
- Tipos de Gráficos
- Gráfico de líneas
- Este tipo de gráfico tiene campos
enteros de las matemáticas dedicados
casi exclusivamente a él.Hay una
multitud infinita de funciones
diferentes que pueden trazarse en
esta gráfica y manipularse para
resolver problemas de forma que se
adapten fácilmente a los números
grandes.
- This kind of graph has entire fields of
math dedicated to it almost exclusively.
There is an infinite multitude of
different functions that can be plotted
on this graph and manipulated to solve
problems in a way that easily
accommodates large numbers.
- This kind of graph has entire fields of
math dedicated to it almost exclusively.
There is an infinite multitude of
different functions that can be plotted
on this graph and manipulated to solve
problems in a way that easily
accommodates large numbers.
- Este tipo de gráfico tiene campos
enteros de las matemáticas dedicados
casi exclusivamente a él.Hay una
multitud infinita de funciones
diferentes que pueden trazarse en
esta gráfica y manipularse para
resolver problemas de forma que se
adapten fácilmente a los números
grandes.
- Diagramas de Cajas
- Este gráfico se utiliza en estadística descriptiva
para representar visualmente información útil
sobre un conjunto de datos. Representa
fácilmente el rango del conjunto de datos, la
mediana y cualquier valor atípico en el conjunto
de datos. Un valor atípico se define como el que
está a 1,5 rangos de cuartil del primer o tercer
cuartil.
- This graph is used in descriptive statistics to visually represent useful information about a set of
data. It easily represents the range of the dataset, the median, and any outliers on the dataset. An
outlier is defined as being 1.5 quartile ranges away from the first or third quartile.
- This graph is used in descriptive statistics to visually represent useful information about a set of
data. It easily represents the range of the dataset, the median, and any outliers on the dataset. An
outlier is defined as being 1.5 quartile ranges away from the first or third quartile.
- Este gráfico se utiliza en estadística descriptiva
para representar visualmente información útil
sobre un conjunto de datos. Representa
fácilmente el rango del conjunto de datos, la
mediana y cualquier valor atípico en el conjunto
de datos. Un valor atípico se define como el que
está a 1,5 rangos de cuartil del primer o tercer
cuartil.
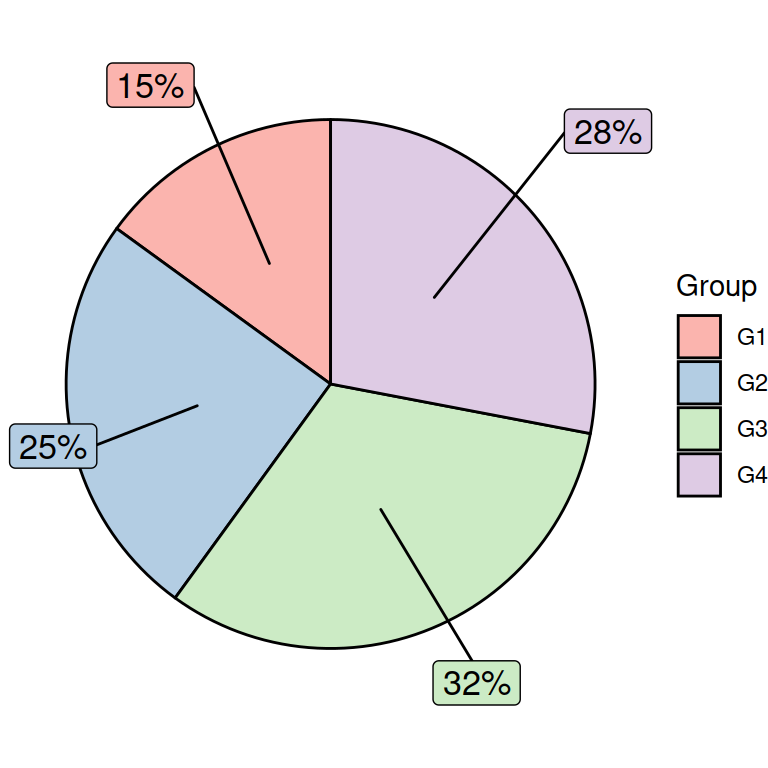
- Diagramas circulares
- Este tipo de gráfico se utiliza
para representar visualmente
porcentajes de datos
categóricos. También pueden
utilizarse para datos
numéricos, pero con una
funcionalidad limitada.
- This type of graph is used to visually
represent percentages of categorical data.
They can also be used for numerical data,
but with limited functionality.
- This type of graph is used to visually
represent percentages of categorical data.
They can also be used for numerical data,
but with limited functionality.
- Este tipo de gráfico se utiliza
para representar visualmente
porcentajes de datos
categóricos. También pueden
utilizarse para datos
numéricos, pero con una
funcionalidad limitada.
- Gráfico de líneas
- Tipos de Gráficos
- Gráficos
- Estadísticas
- Cuartiles
- Primer Cuartil
- The quartiles of a dataset are smaller versions
of the mean of that dataset. Once you have
found the mean, then divide all numbers of the
dataset which are above and below the
median separately in the same manner that
the median was found. Of the new ‘medians’
that you create, the left one is the first
quartile, and the right one is the third quartile.
Technically, the median is also a quartile (the
second) but not many people call it that.
- Los cuartiles de un conjunto de datos son versiones
más pequeñas de la mediana de ese conjunto de
datos. Una vez que hayas encontrado la mediana,
divide todos los números por encima y por debajo de
la mediana por separado de la misma manera que se
encontró la media. De las nuevas "medianas" que
crea, la "mediana" izquierda es el primer cuartil, y la
"mediana" derecha es el tercer cuartil.
Técnicamente, la mediana es también un cuartil (el
segundo), pero no mucha gente se refiere a la
mediana de esa manera.
- The quartiles of a dataset are smaller versions
of the mean of that dataset. Once you have
found the mean, then divide all numbers of the
dataset which are above and below the
median separately in the same manner that
the median was found. Of the new ‘medians’
that you create, the left one is the first
quartile, and the right one is the third quartile.
Technically, the median is also a quartile (the
second) but not many people call it that.
- Segundo Cuartil
- Mediana
- Mediana
- Tercer Cuartil
- Primer Cuartil
- Moda
- El modo de un conjunto de datos
es un número que se registra el
más dentro de un conjunto
determinado. El modo modo se
utiliza cuando se calculan datos
categóricos -un tipo de datos que
los promedios no pueden ser no
se pueden calcular los
promedios.
- The mode of a set of data is a
number that is recorded the
most within any given set. The
mode is used when calculating
categorical data—a kind of data
that averages cannot be
calculated for
- The mode of a set of data is a
number that is recorded the
most within any given set. The
mode is used when calculating
categorical data—a kind of data
that averages cannot be
calculated for
- El modo de un conjunto de datos
es un número que se registra el
más dentro de un conjunto
determinado. El modo modo se
utiliza cuando se calculan datos
categóricos -un tipo de datos que
los promedios no pueden ser no
se pueden calcular los
promedios.
- Desviación estándar
- Varianza estándar
- La varianza mide el grado medio
en que cada punto difiere de la
media, el promedio de todos los
puntos de datos.
- The variance measures
the average degree to
which each point differs
from the mean—the
average of all data
points.
- The variance measures
the average degree to
which each point differs
from the mean—the
average of all data
points.
- La varianza mide el grado medio
en que cada punto difiere de la
media, el promedio de todos los
puntos de datos.
- La desviación estándar es la base de la
investigación científica. Tiene conexiones
directas tanto con la investigación como
con la hipótesis nula. Los datos que
están estrechamente agrupados tendrán
una desviación estándar pequeña,
mientras que los datos que están
dispersos y tienen poca correlación
tendrán desviaciones estándar
grandes. El 99,7% de los datos se
encontrarán dentro de tres σ de la
mediana.
- Standard deviation is the foundation of
scientific research. It has direct
connections to both the research and
the null hypothesis. Data that is closely
grouped together will have a small
standard deviation, while data that is
scattered and has little correlation will
have large standard deviations. 99.7% of
all data will find itself within three σ of
the median
- Más básicamente… La
desviación estándar examina el
grado de dispersión de un grupo
de números respecto a la
media, observando la raíz
cuadrada de la varianza.
- More basically… Standard
deviation looks at how
spread out a group of
numbers is from the
mean, by looking at the
square root of the
variance.
- More basically… Standard
deviation looks at how
spread out a group of
numbers is from the
mean, by looking at the
square root of the
variance.
- Standard deviation is the foundation of
scientific research. It has direct
connections to both the research and
the null hypothesis. Data that is closely
grouped together will have a small
standard deviation, while data that is
scattered and has little correlation will
have large standard deviations. 99.7% of
all data will find itself within three σ of
the median
- Varianza estándar
- Promedios
- Promedio Simples
- La media simple es el tipo de
media que aprenden todos los
niños de Estados Unidos, aunque
no estamos seguros de por qué.
Se trata de tomar cada punto de
los datos dentro de un conjunto
determinado y sumarlos, para
luego dividir el total resultante
por *n*, donde *n* es igual al
número de términos
individuales dentro del conjunto.
- The simple average is the kind of
average that every child in the
States learns about—though we’re
not sure why. It is where you take
every point of data within a given
set and add them together, then
divide the resulting total by *n*,
where *n* is equal to the number of
individual terms within the set.
- La media simple es el tipo de
media que aprenden todos los
niños de Estados Unidos, aunque
no estamos seguros de por qué.
Se trata de tomar cada punto de
los datos dentro de un conjunto
determinado y sumarlos, para
luego dividir el total resultante
por *n*, donde *n* es igual al
número de términos
individuales dentro del conjunto.
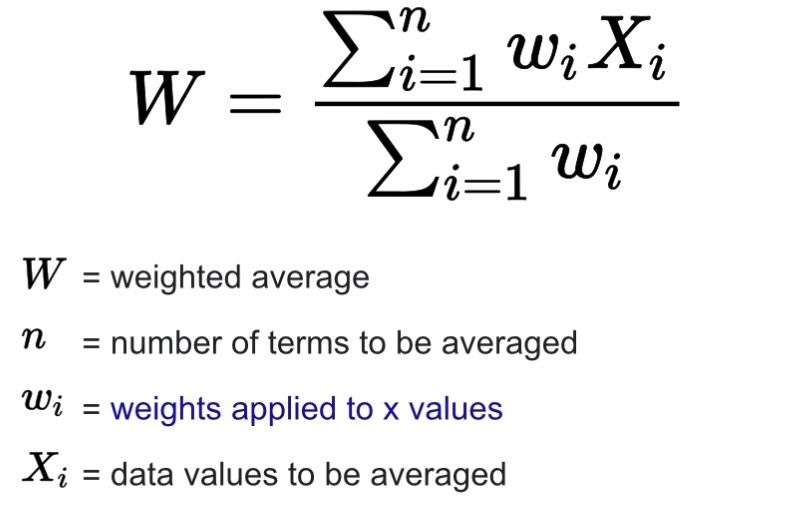
- Promedio Ponderado
- La media ponderada es un cálculo que tiene en
cuenta los distintos grados de importancia de
los números de un conjunto de datos. Al calcular
una media ponderada, cada número del
conjunto de datos se multiplica por un peso
predeterminado antes de realizar el cálculo
final. La media ponderada tiene en cuenta la
importancia relativa o la frecuencia de algunos
factores en un conjunto de datos. Una media
ponderada es a veces más precisa que una
media simple. Los inversores en acciones
utilizan una media ponderada para hacer un
seguimiento de la base de coste de las acciones
compradas en distintos momentos.
- Weighted average is a calculation that takes
into account the varying degrees of importance
of the numbers in a data set. In calculating a
weighted average, each number in the data set
is multiplied by a predetermined weight before
the final calculation is made. The weighted
average takes into account the relative
importance or frequency of some factors in a
data set. A weighted average is sometimes
more accurate than a simple average. Stock
investors use a weighted average to track the
cost basis of shares bought at varying times.
- La media ponderada es un cálculo que tiene en
cuenta los distintos grados de importancia de
los números de un conjunto de datos. Al calcular
una media ponderada, cada número del
conjunto de datos se multiplica por un peso
predeterminado antes de realizar el cálculo
final. La media ponderada tiene en cuenta la
importancia relativa o la frecuencia de algunos
factores en un conjunto de datos. Una media
ponderada es a veces más precisa que una
media simple. Los inversores en acciones
utilizan una media ponderada para hacer un
seguimiento de la base de coste de las acciones
compradas en distintos momentos.
- Promedio Simples
- Cuartiles
- Probabilidades
- Eventos y tipos
- No entiendo lo que quiere decir o quiere con esto
- No entiendo lo que quiere decir o quiere con esto
- Probabilidad de un evento
- La probabilidad de un evento es el
número de resultados favorables
dividido por el número total de
resultados posibles.
- The probability of an event is
the number of favorable
outcomes divided by the
total number of outcomes
possible.
- The probability of an event is
the number of favorable
outcomes divided by the
total number of outcomes
possible.
- La probabilidad de un evento es el
número de resultados favorables
dividido por el número total de
resultados posibles.
- Complementos
- El complemento de un conjunto mira un
conjunto cualquiera y los datos que
contiene, y otro conjunto y los datos que
contiene. Cualquier dato que aparezca en
el primer conjunto pero que NO aparezca
en el segundo es el complemento del
segundo conjunto.
- The compliment of a set looks
at any one set and the data
within it, and another set and
the data within that one. Any
data that appears in the first
set but DOES NOT appear in
the second set is the second
set’s complement.
- The compliment of a set looks
at any one set and the data
within it, and another set and
the data within that one. Any
data that appears in the first
set but DOES NOT appear in
the second set is the second
set’s complement.
- El complemento de un conjunto mira un
conjunto cualquiera y los datos que
contiene, y otro conjunto y los datos que
contiene. Cualquier dato que aparezca en
el primer conjunto pero que NO aparezca
en el segundo es el complemento del
segundo conjunto.
- Probabilidades condicionales
- Cuál sería (o será) la probabilidad
de un suceso si ocurre otra cosa. Es
(probable) que jures si se te cae un
martillo en los dedos de los pies.
- What the probability of an event would be
(or will be) if something else happens. You
will (probably) swear if you drop a hammer
on your toes.
- What the probability of an event would be
(or will be) if something else happens. You
will (probably) swear if you drop a hammer
on your toes.
- Cuál sería (o será) la probabilidad
de un suceso si ocurre otra cosa. Es
(probable) que jures si se te cae un
martillo en los dedos de los pies.
- Diagramas de árbol
- A tree diagram connects many different events to each other starting
from a principle event. Also called branching diagrams, these
diagrams take one event and two other events. The two other events
each have an equal likelihood of occurring after the principle event
and can have other events branch off of them. This creates tiers of
the tree. The principle event, the secondary event, the tertiary event,
and so on unto infinity.
- Un diagrama de árbol conecta muchos eventos diferentes entre sí a partir de un evento principal.
También llamados diagramas de ramificación, estos diagramas toman un evento y otros dos eventos.
Cada uno de los otros dos sucesos tiene la misma probabilidad de ocurrir después del suceso
principal y puede tener otros sucesos que se ramifican a partir de ellos. Así se crean los niveles del
árbol. El suceso principal, el secundario, el terciario y así hasta el infinito.
- A tree diagram connects many different events to each other starting
from a principle event. Also called branching diagrams, these
diagrams take one event and two other events. The two other events
each have an equal likelihood of occurring after the principle event
and can have other events branch off of them. This creates tiers of
the tree. The principle event, the secondary event, the tertiary event,
and so on unto infinity.
- Eventos y tipos
- Recopilación de información
- Métodos
- Cuestionarios
- What is a questionnaire?
- Write it here first
- Write it here first
- What is a questionnaire?
- Encuestas
- What is a survey?
- Write it here first
- Write it here first
- Tipos de Encuestas
- What is a survey?
- Cuestionarios
- Métodos
- Incluí el inglés original en
caso de que las traducciones
no tuvieran sentido. Si tiene
dificultades para
comprender, pídale a un
alumno que lea la versión en
inglés.
Media attachments
Want to create your own Mind Maps for free with GoConqr? Learn more.