
Mind map
Bullying: Background
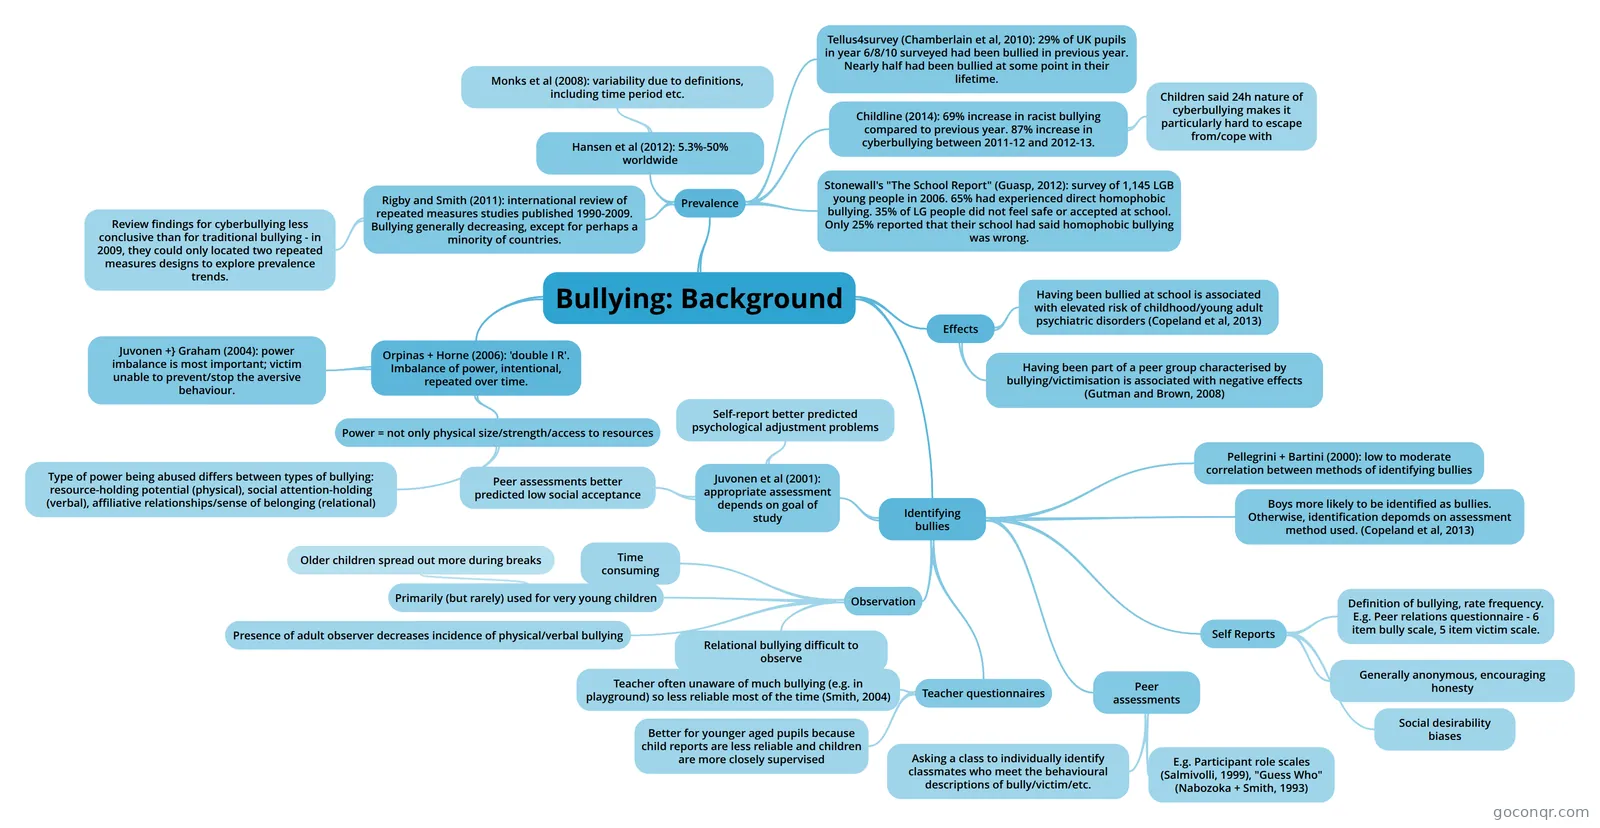
Mind map: bullying background
Map content
Bullying: Background
Orpinas + Horne (2006): 'double I R'. Imbalance of power, intentional, repeated over time.
- Juvonen +} Graham (2004): power imbalance is most important; victim unable to prevent/stop the aversive behaviour.
- Power = not only physical size/strength/access to resources
- Type of power being abused differs between types of bullying: resource-holding potential (physical), social attention-holding (verbal), affiliative relationships/sense of belonging (relational)
Prevalence
- Hansen et al (2012): 5.3%-50% worldwide
- Monks et al (2008): variability due to definitions, including time period etc.
- Tellus4survey (Chamberlain et al, 2010): 29% of UK pupils in year 6/8/10 surveyed had been bullied in previous year. Nearly half had been bullied at some point in their lifetime.
- Childline (2014): 69% increase in racist bullying compared to previous year. 87% increase in cyberbullying between 2011-12 and 2012-13.
- Children said 24h nature of cyberbullying makes it particularly hard to escape from/cope with
- Stonewall's "The School Report" (Guasp, 2012): survey of 1,145 LGB young people in 2006. 65% had experienced direct homophobic bullying. 35% of LG people did not feel safe or accepted at school. Only 25% reported that their school had said homophobic bullying was wrong.
- Rigby and Smith (2011): international review of repeated measures studies published 1990-2009. Bullying generally decreasing, except for perhaps a minority of countries.
- Review findings for cyberbullying less conclusive than for traditional bullying - in 2009, they could only located two repeated measures designs to explore prevalence trends.
- Hansen et al (2012): 5.3%-50% worldwide
Effects
- Having been bullied at school is associated with elevated risk of childhood/young adult psychiatric disorders (Copeland et al, 2013)
- Having been part of a peer group characterised by bullying/victimisation is associated with negative effects (Gutman and Brown, 2008)
Identifying bullies
- Pellegrini + Bartini (2000): low to moderate correlation between methods of identifying bullies
- Boys more likely to be identified as bullies. Otherwise, identification depomds on assessment method used. (Copeland et al, 2013)
- Self Reports
- Definition of bullying, rate frequency. E.g. Peer relations questionnaire - 6 item bully scale, 5 item victim scale.
- Generally anonymous, encouraging honesty
- Social desirability biases
- Peer assessments
- Asking a class to individually identify classmates who meet the behavioural descriptions of bully/victim/etc.
- E.g. Participant role scales (Salmivolli, 1999), "Guess Who" (Nabozoka + Smith, 1993)
- Teacher questionnaires
- Teacher often unaware of much bullying (e.g. in playground) so less reliable most of the time (Smith, 2004)
- Better for younger aged pupils because child reports are less reliable and children are more closely supervised
- Observation
- Primarily (but rarely) used for very young children
- Older children spread out more during breaks
- Time consuming
- Relational bullying difficult to observe
- Presence of adult observer decreases incidence of physical/verbal bullying
- Primarily (but rarely) used for very young children
- Juvonen et al (2001): appropriate assessment depends on goal of study
- Self-report better predicted psychological adjustment problems
- Peer assessments better predicted low social acceptance
Information
- Description
- University Educational Psychology Mind Map on Bullying: Background, created by Maisie Rose Woodward on 11/01/2016.
- Created by
- Maisie Rose Woodward
- Views
- 583
- Tags
- Rating