
Mind map
Correlation
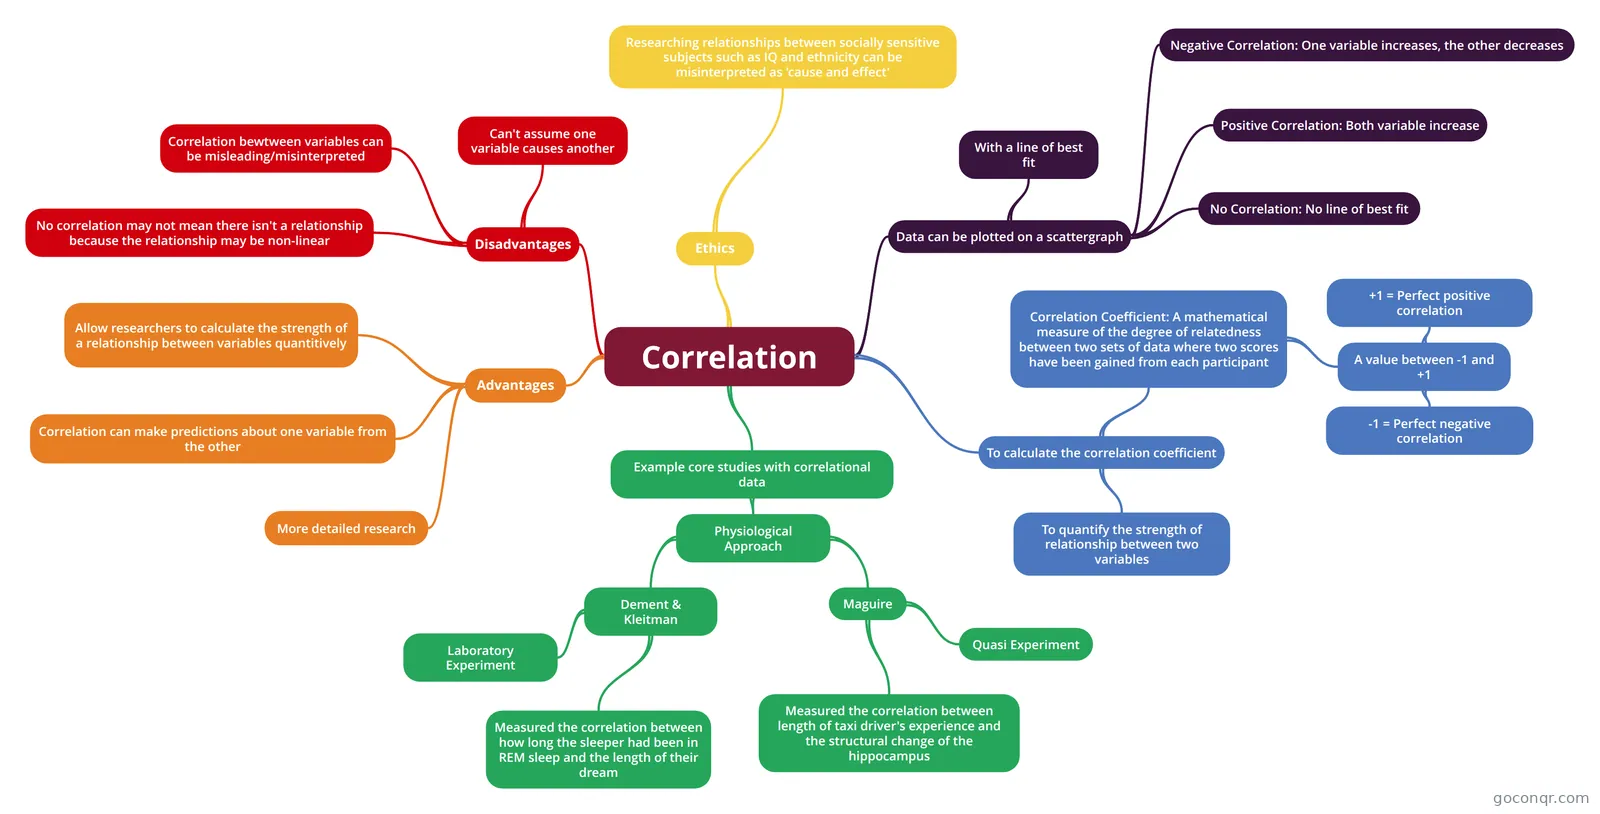
Mind map: correlation
Map content
Correlation
Example core studies with correlational data
- Physiological Approach
- Dement & Kleitman
- Laboratory Experiment
- Measured the correlation between how long the sleeper had been in REM sleep and the length of their dream
- Maguire
- Quasi Experiment
- Measured the correlation between length of taxi driver's experience and the structural change of the hippocampus
- Dement & Kleitman
- Physiological Approach
To calculate the correlation coefficient
- To quantify the strength of relationship between two variables
- Correlation Coefficient: A mathematical measure of the degree of relatedness between two sets of data where two scores have been gained from each participant
- A value between -1 and +1
- +1 = Perfect positive correlation
- -1 = Perfect negative correlation
- A value between -1 and +1
Data can be plotted on a scattergraph
- With a line of best fit
- Positive Correlation: Both variable increase
- No Correlation: No line of best fit
- Negative Correlation: One variable increases, the other decreases
Advantages
- Allow researchers to calculate the strength of a relationship between variables quantitively
- Correlation can make predictions about one variable from the other
- More detailed research
Disadvantages
- Can't assume one variable causes another
- Correlation bewtween variables can be misleading/misinterpreted
- No correlation may not mean there isn't a relationship because the relationship may be non-linear
Ethics
- Researching relationships between socially sensitive subjects such as IQ and ethnicity can be misinterpreted as 'cause and effect'