
Flashcards
Statistical Analysis and Design
Cards in this deck (116)
- 1Define Descriptive StatisticsNumerical summaries & visualisations that summarise the sample
- 2Examples of Descriptive StatisticsBarplots, boxplots, scatterplots, violin plots
- 3Point estimates give one ____ ____ of the datacentre point
- 4Examples of point estimatesMeans, medians, modes
- 5Interval estimates give indication of the ____ of the data.spread
- 6Examples of interval estimatesStandard deviation, standard errors, confidence intervals
- 7Define Inferential Statisticstests used to reach conclusions about populations based on samples. Uses probability to determine whether an effect exists
- 8Examples of Inferential StatisticsChi-squares, t-tests, ANOVAs, correlations, Null Hypothesis significance testing
- 9Key aims when presenting descriptivesTo compare conditions in relation to a hypothesis
Common issue is purely stating the descriptives with no comparison - 10What do descriptives not doThe descriptives do not confirm, support or reject a hypothesis
Only the inferential stats confirm, support or reject a hypothesis
Descriptives can only suggest a difference is consistent or inconsistent with a hypothesis - 11Measures of Central TendencyMean, Median and Mode
- 12Mean APA abbreviationM = ...
- 13Median APA abbreviationMdn = ...
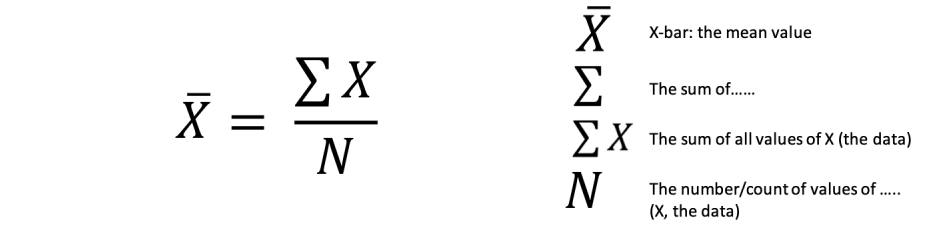
- 14Mean Arithmetic Average Formula
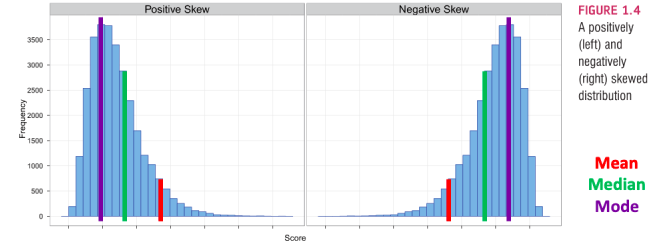
- 15If the mean, mode and median are not all equal, the data (histogram) will not be...symmetrical.
- 16The size of the skew affects the mean, median and mode...differently.
- 17The mean is always ____ in the direction of the skew than the ____.further
median - 18The median is in turn ____ in the direction of the skew than the ____.further
mode - 19The mode is ____ affected by skew but is also the ___ informative.least
least - 20Positive vs Negative skew
- 21Define KurtosisKurtosis relates to the peakiness or flatness of the distribution and is a measure of the degree to which the data clusters in the tails of the distribution.
- 22What are the two main types of Kurtosis?Leptokurtic and Platykurtic
- 23Visualisations of Kurtosis
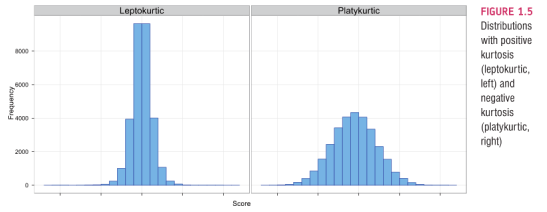
- 24Explain Leptokurtic (positive kurtosis)very pointy in the middle, with lots of data stretching out in both of the tails
- 25Explain Platykurtic (negative kurtosis)thin in the tails and rather flatter in the middle
- 26In severely skewed data, stating and analysing the ___ may be more appropriate than the ___.median
mean - 27The ___ is more informative than the ___ and less affected by the skew than the ____.median
mode
mean - 28The ___ can be very misleading statistic if it differs a lot from median or mode.mean
- 29Define Spreadthe degree of dispersion of values in a dataset
- 30Examples of spreadRange
Interquartile Range
Variance
Standard Deviation - 31Disadvantages of Spread measuresLeast informative as it is only based on two values of the data
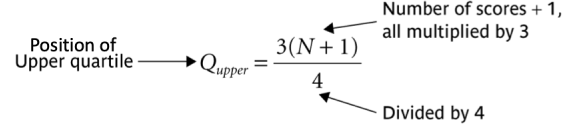
Is ver sensitive to outliers - 32Define Interquartile Range (IQR)A range of summarising the values between the 25th and 75th percentiles.
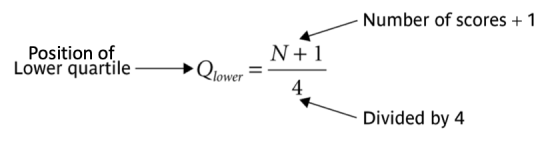
Works by putting all the scores in order of lowest to highest (like the median), dividing it into quarters, and then chopping off the extreme upper and lower quarters - 33Lower Quartile Range Formula
- 34Higher Quartile Range Formula
- 35Advantages of boxplotsUseful for displaying centre and spread of a distribution, as well as potential outliers
- 36Explain Violin PlotsEssentially a rotated histogram and is effective for combining histograms and boxplots.
- 37Define VarianceA measure of spread which uses information from all scores in a set
- 38Variance Formula

- 39PWe squared the deviations but didn't 'undo' the squaring.
Meaning the variance does not describe the variability in the units of the original scale. - 40Solution to the problems with VarianceTake the square root of s2
- 41Define Standard Deviationa measure of the average deviation from the mean in the original scale, using all the values in the data
- 42Standard Deviation APA abbreviationSD
- 43Standard Deviation formula

- 44Define Standard Error of the MeanA measure of deviation of the sample mean from the population mean
- 45Standard Error of the Mean formula

- 46Define ProbabilityThe likelihood of the occurrence of an event or outcome
- 47Probability formula

- 48Define joint probabilityThe likelihood of two unrelated events occurring is calculated by multiplying together the probability of each individual event.
- 49Example of Joint probability formula in practise

- 50Visualisation of Binomial Distribution
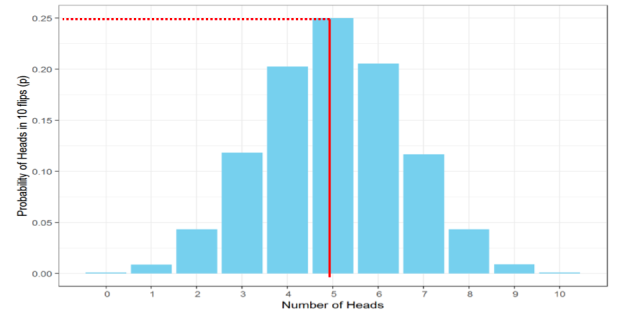
- 51How to find accumulative probability?Combine the values of the columns desired from the Binomial Distribution
- 52All of the columns combined in a Binomial Distribution will equal...1
- 53Mean and Standard Deviation are normally rounded to...2 decimal places
- 54Probability and p-values are normally rounded to...3 decimal places
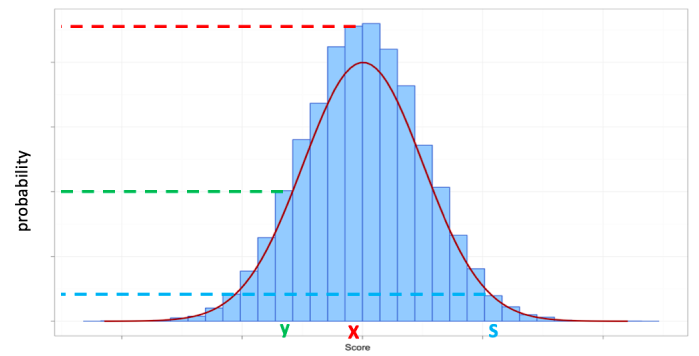
- 55In a normal distribution the peak of the distribution corresponds to the...mean, median and mode.
- 56In a normal distribution the mean, median and mode all equal ___ and the standard deviation equals ___.0
1 - 57Visualisation of Normal Distribution
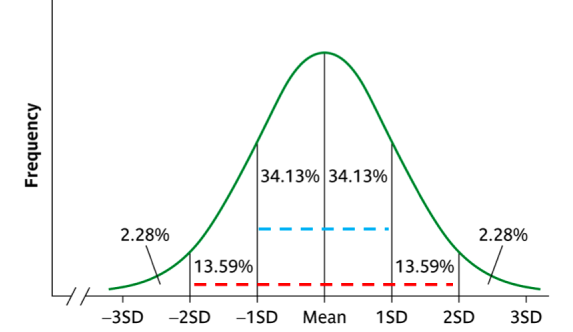
- 58Frequency values vs SD
- 59Define alpha valuethe probability level at which we accept the null hypothesis
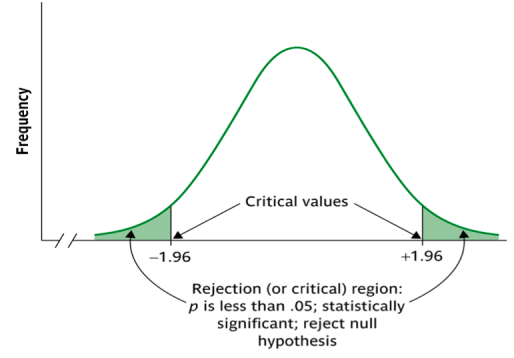
- 60Alpha value in psychology is...0.05 or p < 0.05
- 61A value in the rejection region, has a probability value ___ than the alpha level. Therefore, we are very ____ to find this result if the null hypothesis was true.less
unlikely - 62Visualisation of the Rejection Regions
- 63Define z-scorethe number of standard deviations any particular score is away from the mean
- 64z-score formula
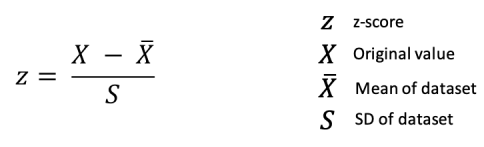
- 65Some researchers state that anything above 2.5SD or 2.5 z-scores is an...outlier
- 66Define Confidence Intervala range of values that is expected to capture the true value of a parameter.
CIs are an estimate of the number of samples that would contain the mean using the data you have collected, based on probability. - 67The ___ separation of C.I. between the two samples the ___ the probability of a significant difference between the two samples.larger
higher - 68Assumptions for chi-square testsAssumes independent measurements (each 'subject' contributes one observation)
Nominal-scale data (at least 2 [or more] categorical outcomes) - 69One-Sample Chi-square testWe are only interested in whether the observed categorical frequency distribution differs from what would be expected by chance
- 70The Observed frequencies in a chi-square test are the...actual counts per category
- 71The Expected frequencies in a chi-square test represent a...uniform frequency distribution expected under the null hypothesis
- 72One-Sample Chi-Square Test formula

- 73In a one-sample chi-square degrees of freedom relates...to the number of conditions compared.
- 74Define degrees of freedomThe number of observations (units/data points) that are free to vary to produce a known outcome (statistical parameter).
- 75Standard APA write-up chi-square testx2 (df, N) = chi-square value, p-value, effect size
- 76Define Effect Sizea standardise measure of the difference of interest
- 77In exams p-values should be written as...p > .05
p < .05 - 78Define p-valuethe probability of finding a test statistic as large, or larger, than the one found in your study, if the null hypothesis is true.
- 79Explain Cross-Tabulation Chi-Square TestThe one-sample chi-square test is only useful for testing categorical response distributions in a single sample. Most of the time we want to know how one variable relates to the distribution of outcomes in another variable.
- 80Cross-Tabulation Chi-Square Test Formula
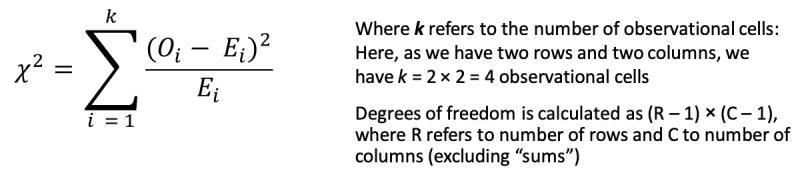
- 81Cramer's V Formula
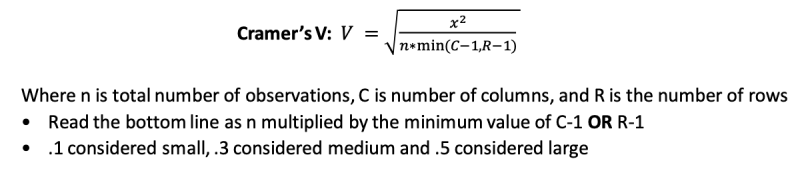
- 82Define t-testan inferential test used to compare differences between two samples/conditions
- 83Visualisation of variance in t-tests
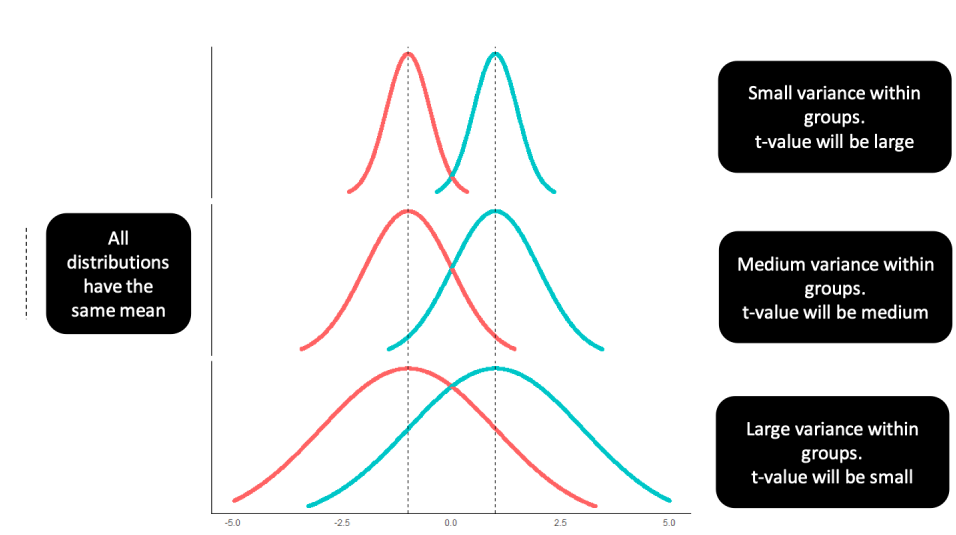
- 84Explain One sample t-testCompare one sample against a known test-value
- 85Explain Paired/Matched/Dependent/Within-samples t-testCompare two conditions where it is the same participants in each condition or compare two conditions where it is different participants but they have been closely matched on a criteria
- 86Explain Independent/between-sample t-testCompare two groups or conditions where the participants are different in each group and have not been matched
- 87Define powerPower is the long run probability of your experimental design correctly rejecting the null hypothesis when there is a true effect to be found, for a given effect size and sample size.
- 88What does APES stand for?Alpha
Power
Effect Size
Sample Size - 89List Common Approaches with PowerDetermine the number of participants required for your study
Determine what size of effect your study can reliably find - 90___ and ___ are pre-determined by the field.Power
alpha - 91To obtain greater power in your design for a given effect size and alpha, you need to ____ the N.increase
- 92Smaller effect sizes require ____ sample sizes for given Power and alpha.larger
- 93A small sample size can only ever reliably find ___ effect sizes for a given Power and alpha.large
- 94One-Sample t-test formulaThe mean of the sample (x) minus criterion mean (u) divided by standard deviation (SD) over the square root of N
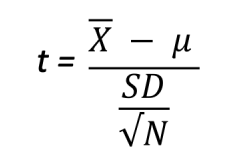
- 95One-Sample Effect Size Formula
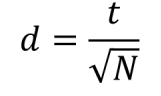
- 96If the df you need is not on the look-up table then go to the next ___ df.smallest
- 97Assumptions of the One-Sample t-testAssumes interval/ratio data
Assumes scores are independent from each other
Assumes data is approximately normally distributed - 98Explain Between-Subject t-testCompare two groups or conditions where the participants
- 99What are the two types of Between-Subject t-test?Student's t-test and Welch's t-test
- 100Welch's Between-Subject t-test Formula
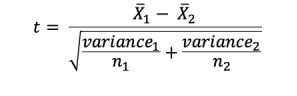
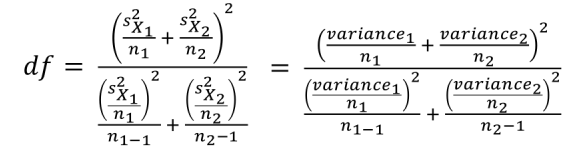
- 101Welch's Between-Subject Degrees of Freedom Formula
- 102Assumptions of Welch's Between-Subject t-testAssumes interval/ration data
Assumes scores are independent from each other
Assumes data is approximately normally distributed
Does not make the assumption of equal variance - 103What is the difference between Student's and Welch's Between-Subject t-test?Student's t-test assumes equal variance, Welch's does not
- 104If your t-value is ___ than the critical value at the appropriate alpha and df then your test is significant at that alpha.larger
- 105An effect size of d = .2 would be considered...small
- 106An effect size of d = .4 would be considered...medium
- 107An effect size of d = .8 would be considered...large
- 108For Welch's t-test ___ ___ round the degrees of freedom.do not
- 109Define a within-subjects t-testCompare two conditions where the participants are the same in both conditions (or are matched participants)
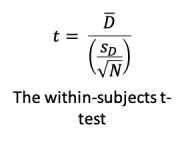
- 110Within-Subject t-test FormulaMean of the difference in scores between the conditions (D), divided by the standard deviation of the difference in scores (SD), over the square root of N.
- 111If your t-value is ___ than the critical value at the appropriate alpha and df then your test is significant at that alpha.larger
- 112Most common effect size for t-tests is called...Cohen's D
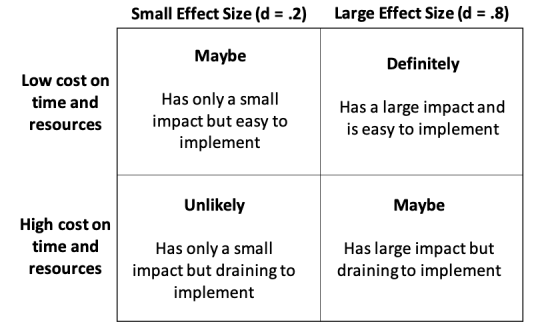
- 113How would I decide what effect size would I be looking for in my stats intervention?
- 114Assumptions of the Within-Subjects t-testAssumes level/ratio data
Levels of measurement - continuous scale
Assumes data is approximately normally distributed (the difference between scores is normally distributed not the original data - 115What are NOT assumptions of the Within-Subjects t-test?Scores are independent
Homogeneity of variance (looks at the difference between the conditions) - 116Explain the matched-pairs approachMatched-pairs approach is where participants in the two conditions are different participants but they have been matched on a variety of demographics so that the only change is the change of interest.
The two groups are effectively considered the same people and so a paired-samples t-test (within-subjects t-test) is run
Information
- Description
- Psychology (2A) Flashcards on Statistical Analysis and Design, created by Hannah Luke on 18/11/2020.
- Created by
- Hannah Luke
- Views
- 0
- Rating