
Mind map
Population
Map content
Population
Migration
- Economic migrant
- Someone who wants to improve their standard of living and voluntarily migrates
- Immigrant
- Someone who enters a country from another country
- Emmigrant
- Someone who leaves a country to go to another country
- Impacts of migration
- Positives
- Boosts economy
- Immigrants usually more successful than they would be in their home country
- Migrants will do jobs that locals refuse or cant do
- Negatives
- Overpopulation
- Locals can become resentful of migrants
- Migrants could be exploited
- Migrants not paid minimum wage
- Tradition and religion clashes
- Positives
- Migration within the EU
- International migration
- Economic migrant
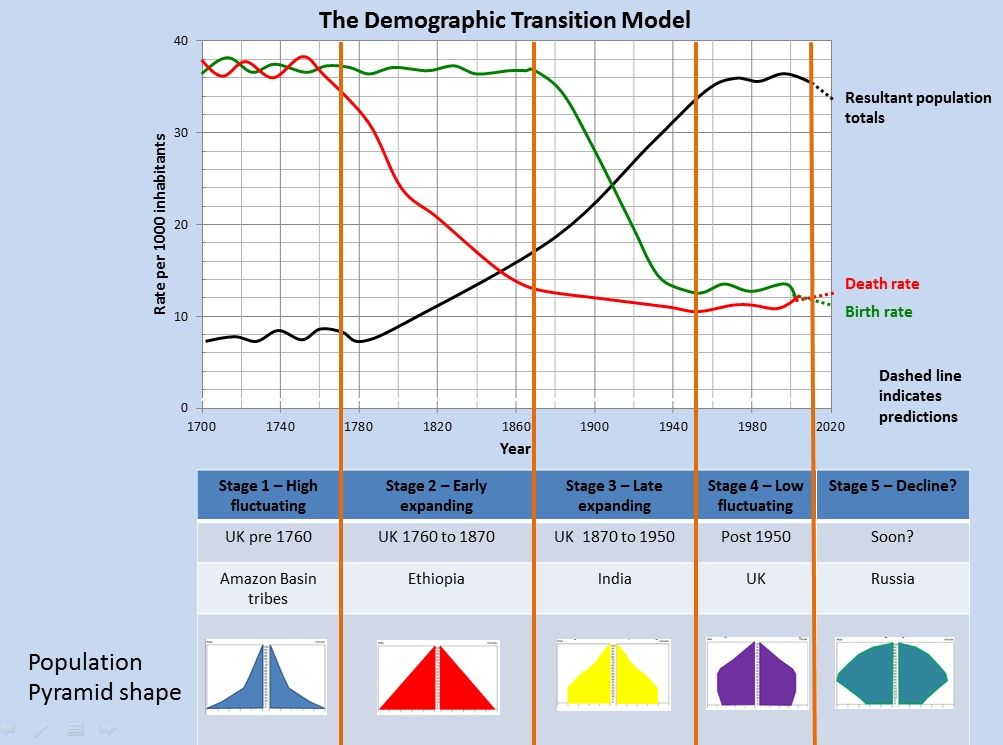
Demographic Transition Model
Factors affecting population growth
- Push factors
- Nautral disasters, difficult climate, famine, only work in agriculture, water shortages, lack of services, poverty, remote, political or social unrest
- Pull factors
- Work in factories, safe water supply, better healthcare, better paid jobs, better education, higher standard of living, attractive environment, reliable food supply
- Other factors
- Agricultural change
- Technology improves yield and saves labour. Machines take over from people
- Education
- As living standards improve, children become an economic disadvantage
- Ub LEDCs parents think education is their childs best chance
- Urbanisation
- Common in poorer countries. Cities offer better opportunities and better education. Child labour is of less value in the city so people have fewer children
- Emancipation of women
- As more women work they have children later in life and have fewer
- Most women now work so have fewer as they have to look after them
- Agricultural change
- Push factors
Population policies
- Kerala
- Location
- South west India
- History
- Population density = 860 people per square kilometre
- BR was high and population density too high
- Introduced in 1960s
- Strategies
- Improving education standards
- Treating boys and girls equally
- Educating women so they have fewer children
- Vaccination programmes
- Providing free contraception
- Encouraging higher age of marriage
- Allocation of land
- Adult literacy classes
- Maternity leave for first two babies only
- Sustainability
- Location
- China One Child Policy
- History
- Implemented in 1979
- Rules
- Must not marry until late 20s
- Must only have one successful pregnancy
- Must be sterilised after first child or must abort future pregnancies
- Recieve 5-10% salary rise if obeying policy
- Penalties
- 10% salary cut
- Large fine that would bankrupt households
- Impacts
- Problems
- Women forced to have abortions up to 9 months into pregnancy
- Women placed under pressure from families
- Government had power over people's private life
- Female infanticide or put into orphanages
- 60 million more young men than women
- Benefits
- Population growth has slowed down
- 400 million fewer people have been born
- Problems
- History
- Indonesia Transmigration Policy
- History
- Introduced in 1945
- Aims
- Ease population density in main cities (Java)
- Eliminate poverty by providing land
- Exploit the outer islands and increase population density in less developed areas
- Problems
- Outer islands have 10% world's forests - deforestation
- Indigenous people displaced
- Cost $7000 per family
- Didn't reduce Java's population much
- Poverty increased by poor farming
- History
- Sweden
- History
- Introduced in 2000
- Management
- Parental leave on 80% salary for 12 months
- 120 days leave to care for sick children on 80% salary
- Adequate provision of heavily subsidised daycare
- High tax rates (30-50%)
- Is it working?
- Fertility rate is 1.9, just below replacement level but it is starting to increase
- History
- Kerala
Key terms
- Birth rate
- Number of births/1000 population
- Death rate
- Number of deaths/1000 population
- Infant mortality
- Number of deaths/1000 children under the age of 1
- Natural increase
- BR>DR
- Natural decrease
- DR>BR
- Life expectancy
- Number of years people are expected to live from birth
- Population density
- Number of people/square km
- Birth rate
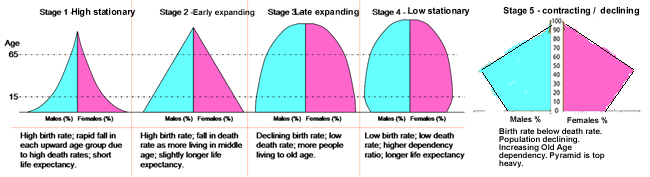
Population pyramids
- Stage 1
- Wide base due to high birth rate. Sides curve quickly inward as infant mortality is high. Death rate is high in all ages and life expectancy is low so the pyramid is short
- Amazon tribes
- Wide base due to high birth rate. Sides curve quickly inward as infant mortality is high. Death rate is high in all ages and life expectancy is low so the pyramid is short
- Stage 2
- Slightly less concave as birth rate falls. Life expectancy rises so height of pyramid increases
- Afghanistan
- Slightly less concave as birth rate falls. Life expectancy rises so height of pyramid increases
- Stage 3
- Narrowing base as birthrate falls. Life expectancy rises.
- Mexico
- Narrowing base as birthrate falls. Life expectancy rises.
- Stage 4
- Pyramid is straight sided as birth rate is low and steady. High life expectancy.
- USA
- Pyramid is straight sided as birth rate is low and steady. High life expectancy.
- Stage 5
- Unsustainable population. Birth rate falls below death rate so base is narrower than other parts of the pyramid.
- Japan
- Unsustainable population. Birth rate falls below death rate so base is narrower than other parts of the pyramid.
- Stage 1
Aging populations
- Causes
- Increasing life expectancy
- Better medical care
- Improved standards of living
- Increasing life expectancy
- Impacts
- Elderly need daycare and nursing homes
- Puts financial pressure on country
- Who pays?
- High dependancy ratio
- Strain on hospitals
- Elderly need daycare and nursing homes
- Solutions
- Housing
- Improved health services
- Facilities and services to keep them more active (mentally and physically)
- East Devon
- Causes
Images and files in the map
Information
- Description
- Mind Map on Population, created by Hannah Sargent7281 on 16/03/2016.
- Created by
- Hannah Sargent7281
- Views
- 6
- Rating