
Mind map
SPSS 6: Linear Regression
Map content
SPSS 6: Linear Regression
-Linear -homoscedastic -little outliers
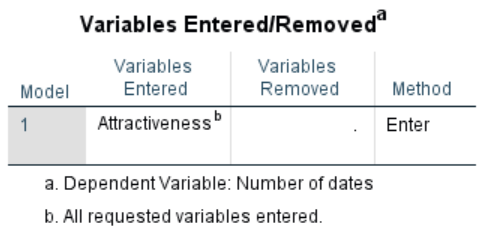
Analyze > Regression > Linear. predictor variables to independent panel and predicted to the dependent. click statistics
- -estimates -confidence intervals -model fit -descriptives -OK
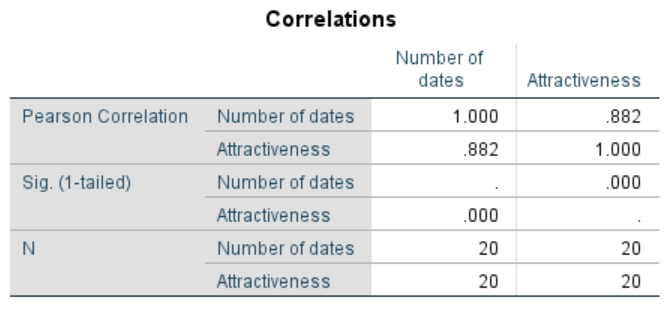
OUTPUT. correlation table = laid out differently to bivariate correlations.
PREDICTOR/NDEPENDENT = in the table, CRITERION/DEPENDENT = underneath the table
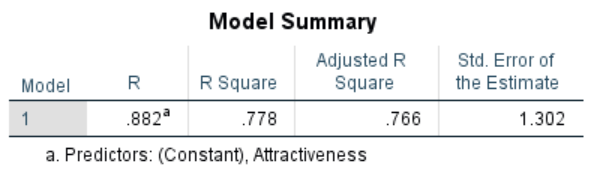
- R = correlation between IV and DV, does not include the sign or direction of the correlatinon, R2 = variance in the DV explained by the IV
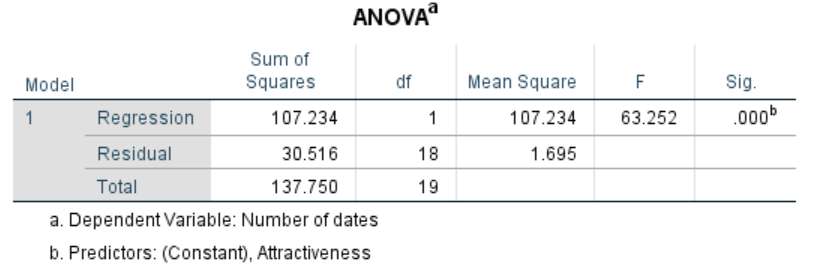
- ANOVA = test statistics e.g. whether it is a significant predictor.
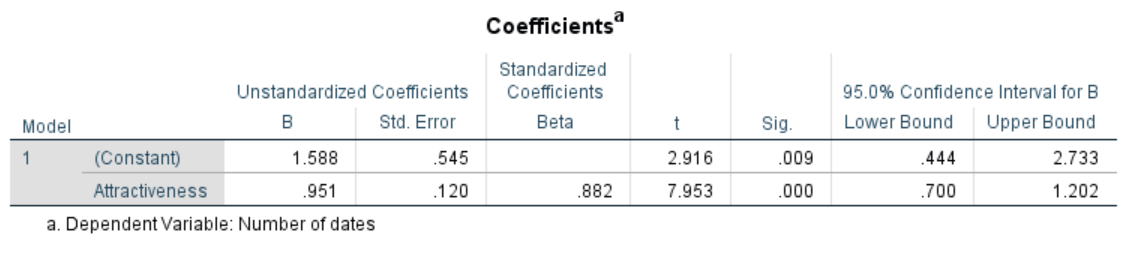
- COEFFICIENTS: constant B = intercept a. Attractiveness/ Predictor B = slope b. report the standardized beta. The t value = if predictor is sig
COEFFICIENTS = the slope of the line and the intercept. B0 e.g. if 1.5, when attractive rating is 0 the model predicts you've had 1.5 dates. B1= slope of the regression line.
- B1 = represents the change in the outcome associated with unit change in predictor. e.g. 0.951. if attractiveness =1, .971 x more dates
- Y = 1.588 + 0.951X
- = the line of best fit on a scatter graph.
- F(1,18) = 63.252, p<.001
- Y = 1.588 + 0.951X
- B1 = represents the change in the outcome associated with unit change in predictor. e.g. 0.951. if attractiveness =1, .971 x more dates
Images and files in the map
Information
- Description
- undergraduate Research Methods Mind Map on SPSS 6: Linear Regression, created by Katie gavriel on 20/03/2019.
- Created by
- Katie gavriel
- Views
- 0
- Rating