
Sampling Distributions, Estimation and Confidence Intervals
46 resources created by 39 users
This GoConqr page gathers over 46 community-made resources on Sampling Distributions, Estimation and Confidence Intervals: quizzes, mind maps, flashcards and notes to revise and practise with.
Top Sampling Distributions, Estimation and Confidence Intervals resources
-
4 cardsStats 151 - Z graph vs. T graph what is df?
-
60 questionsQM 1. The distribution of sample means is:
-
20 cardsUnit 9 - Confidence Intervals with Proportions Test The United States government wants to estimate the proportion of all children in the United States under th...
-
15 questionsChapter 7 If all the possible random samples of size n = 5 are selected from a population with μ = 50 and σ = 10 and ...
-
14 questionsSU17 ADMS2320 Chapter 10 Which of the following is not a characteristic for a good estimator?
-
15 cardsModule 4
-
16 cardsL3 Stats- Statistical Report flashcards
-
20 cardsMgmt Science Session 4 How should I think of a sample average?
Quizzes
-
60 questionsQM 1. The distribution of sample means is:
-
15 questionsChapter 7 If all the possible random samples of size n = 5 are selected from a population with μ = 50 and σ = 10 and ...
-
14 questionsSU17 ADMS2320 Chapter 10 Which of the following is not a characteristic for a good estimator?
-
6 questionsLecture 5. Normal Sampling Distributions and Confidence Intervals
-
2 questionsUntitled
-
1 questionsStats101 The means of samples taken from the same population would vary from sample to sample. The standard deviatio...
Mind maps
See all 10 mind maps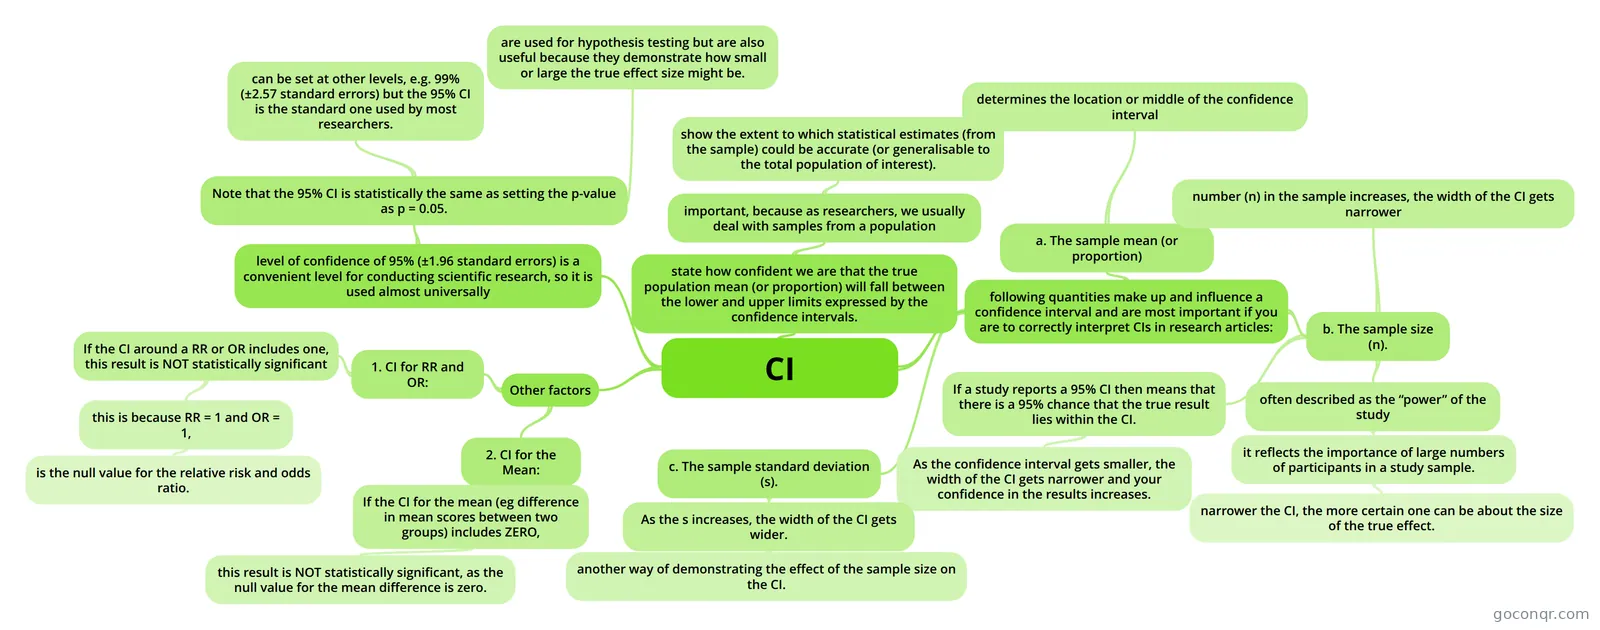
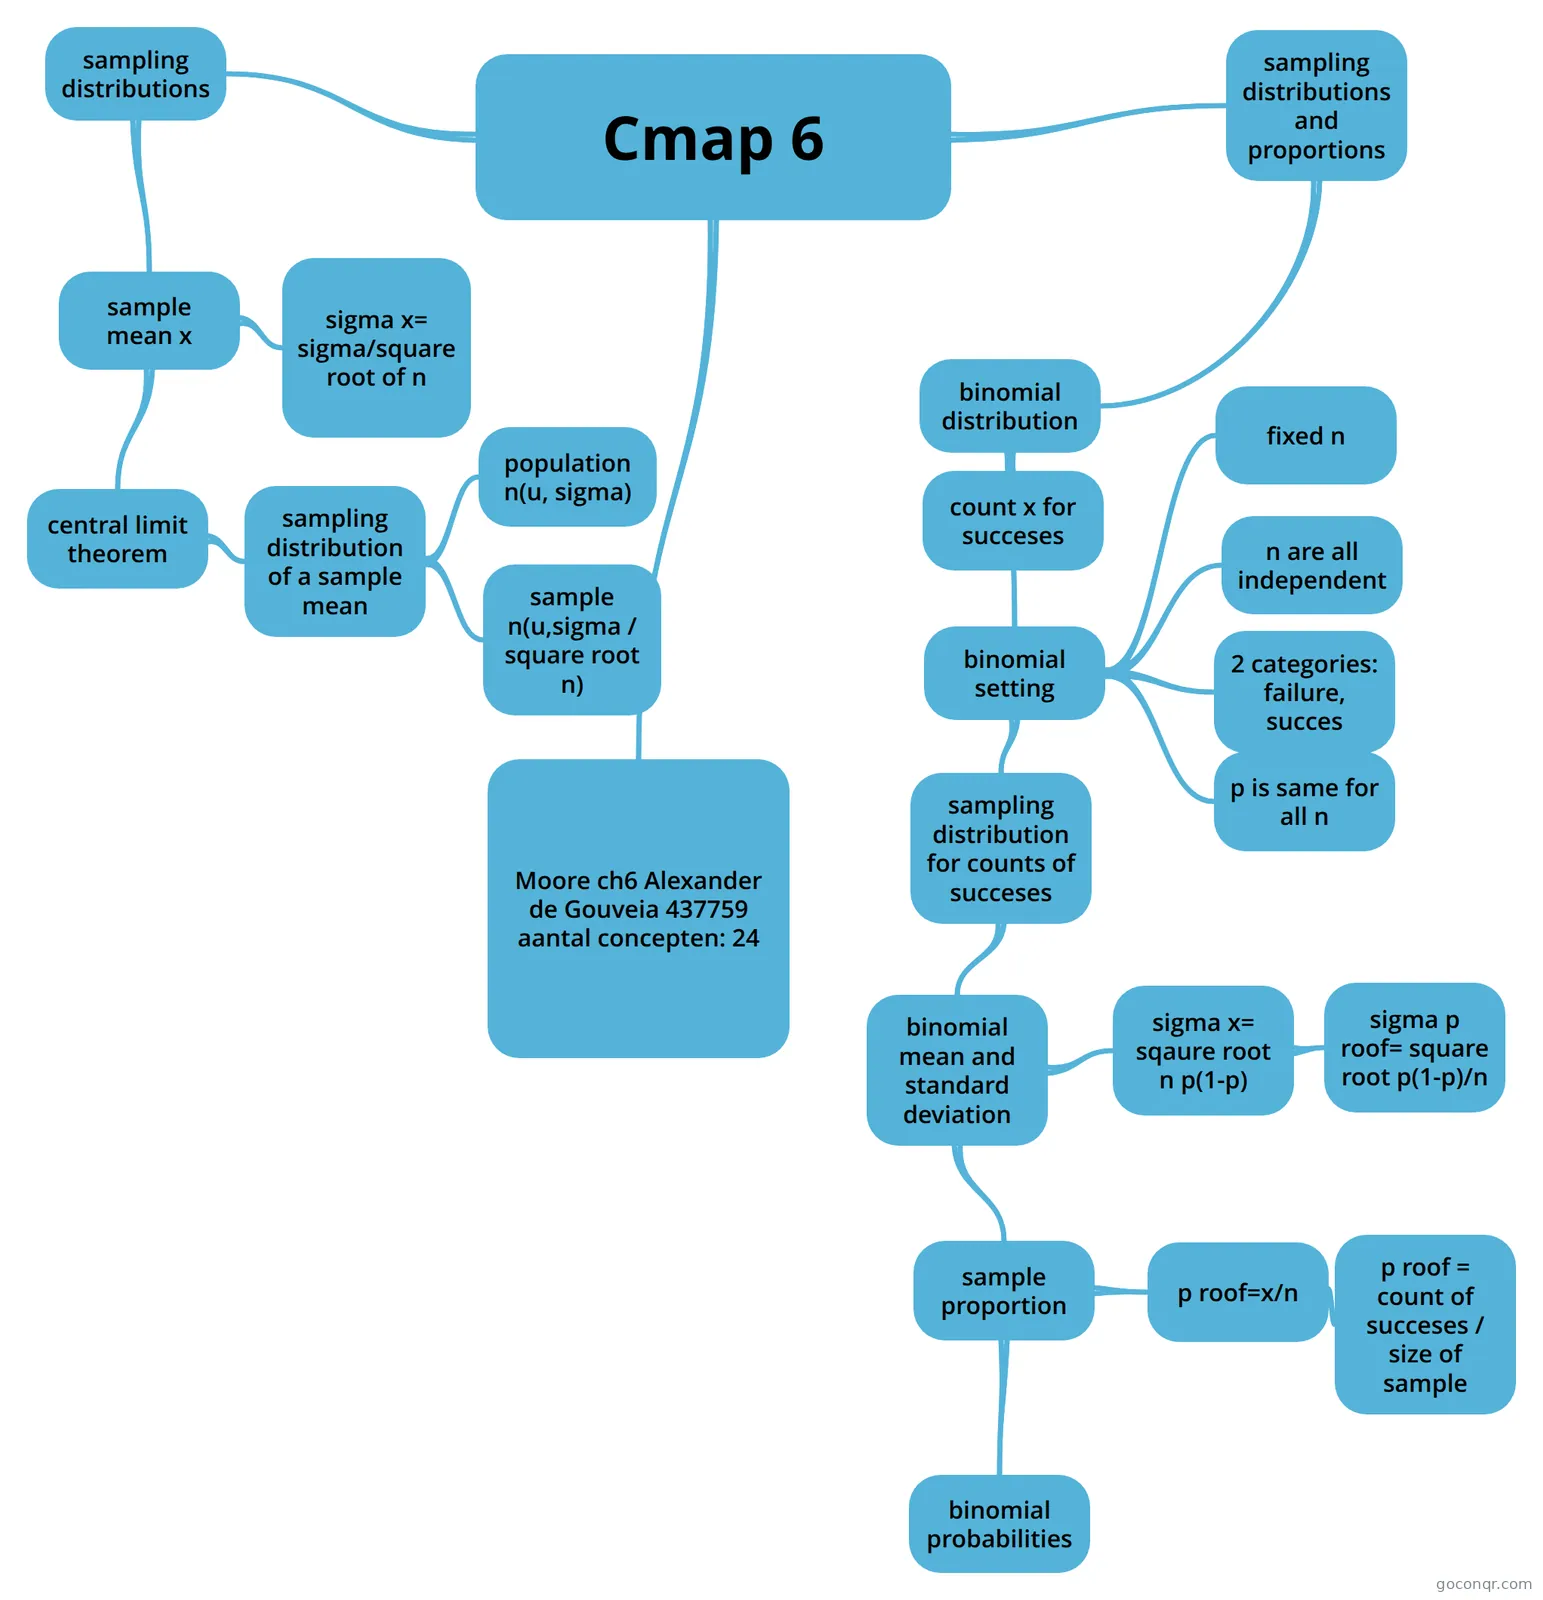
Flashcards
See all 22 flashcards-
4 cardsStats 151 - Z graph vs. T graph what is df?
-
20 cardsUnit 9 - Confidence Intervals with Proportions Test The United States government wants to estimate the proportion of all children in the United States under th...
-
15 cardsModule 4
-
16 cardsL3 Stats- Statistical Report flashcards
-
20 cardsMgmt Science Session 4 How should I think of a sample average?
-
10 cardsUntitled What symbol denotes a sample proportion?
-
22 cardsstats The speed of a certain aircraft is normally distributed. A random sample of 16 aircrafts was selected. Give...
-
19 cardsChapter 8: Sampling Distribution sample mean and sample proportion distributions
Flowcharts
Notes
-
Estimation Practise + L7 Summary Summary Chapter L7 - Sample Means For example Klout Scores with N= 1048, mean=37.72 and sigma = 16.04 When taking any sample x from the population 1048, the mean will equal population mean For the sampling error with ...
-
Central Limit Theorem
-
Sample Mean Comparisons
-
Summary Lesson Population distribution = Population of the statistic Sampling distribution = Distribution for a sample size from the population n = x Sample Error = Standard deviation of the sampling distribution. Adjusted based on ...
Slides
Topics in Sampling Distributions, Estimation and Confidence Intervals
More Statistics and probability topics
About Sampling Distributions, Estimation and Confidence Intervals
GoConqr OriginalWhat this unit covers
The listed resources follow one thread: how a sample tells you something about a population. Some cover the sampling side, such as the mind map Lec 11 Sampling Distributions of the Mean, with its sections on sampling techniques, common biases and the standard error. Others cover estimation and interval building, such as the mind map Chapter 9: Confidence Interval and the flashcards on unbiased estimators.
Where to start
- Begin with the Central Limit Theorem note and the Standard error mind map to get the idea of a sampling distribution.
- Move to the Point Estimation flowchart and the Unbiased Estimators flashcards, which ask how to tell whether an estimator is unbiased and how to judge efficiency.
- Then work on intervals. The Stats Chapter 2 flashcards set out the interval for a mean when sigma is known and what to use when it is unknown.
- Finish with the z and t comparison in Stats 151 - Z graph vs. T graph, which asks what df means and how the two curves differ.
Practice with quizzes and maps
Use a mind map to see how the ideas connect, then test yourself. The Confidence Interval Questions slide set includes a worked-style exercise on sampled milk volumes and asks for a 95% interval. The page also lists quizzes such as Lecture 5. Normal Sampling Distributions and Confidence Intervals. Try one after a map, note which questions slipped, then go back to the matching flashcards.
Where it sits
This unit belongs to the Statistical Inference strand of Statistics and probability. It is made for university-level study, and all the resources were made by GoConqr users. Some listed items stray from the topic, so skip any that do not fit your course.
When you are ready, open a quiz and see what you remember, then build your own flashcards from the gaps.
Frequently asked questions
Which resource should I open first?
Start with the Central Limit Theorem note or the Standard error mind map if sampling distributions are new to you. If you already know them, go straight to the Confidence Interval Questions slide set and try the worked exercises on sampled values.
What do the mind maps cover?
They cover sampling distributions of the mean, sampling techniques and biases, the standard error, confidence intervals, and the sampling distribution of the difference between two means. One also covers maximum likelihood estimation. Use them to see how the topics link before you test yourself.
Are the resources free to use?
Yes. Every resource listed here is free to open, study and take, with no account needed. A free account also saves your quiz scores and lets you make your own quizzes, mind maps, flashcards and notes.
Which levels is this page for?
The listed resources are all university level, so the page suits university students and professional candidates, plus teachers looking for ready-made material. Some decks come from specific courses, so check that the notation matches what you are taught.
Who made these resources?
They were made by GoConqr users, not by GoConqr itself. That means styles differ from one resource to the next. If one does not suit you, try another on the same topic, such as a different flashcard deck on confidence intervals.
What if I cannot find what I need?
Look at related resources, such as the flowcharts on point estimation and sample sizes, or the decks on the t distribution. If a gap remains, make your own flashcards or notes covering that topic.